
Model Evaluation Basics
Performance Measures
When you submit a prediction file to Kaggle, you get back a single number — for example, 0.76555 for the gender-based baseline and 0.77511 for a decision tree. How is that score calculated?
For classification problems, performance is measured with:
- the confusion matrix
- accuracy, precision, and recall (and the F1 score, which combines the last two)
Confusion Matrix
A basic confusion matrix for a binary classification with two classes:
| Actual \ Predicted | Predicted True | Predicted False |
|---|---|---|
| Actual True | ✅ True Positive (TP) | ❌ False Negative (FN) — Type II error |
| Actual False | ❌ False Positive (FP) — Type I error | ✅ True Negative (TN) |
✅ marks correct predictions, ❌ marks wrong predictions.
- A Type I error (false positive) says something is there when it is not.
- A Type II error (false negative) says something is not there when it is.
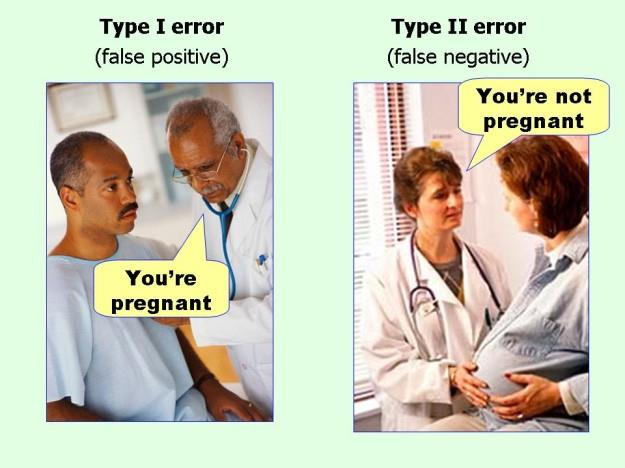
Image credit: https://bit.ly/2UIxPIe
Accuracy
Accuracy is the ratio of correct predictions to all predictions:
Accuracy is the Kaggle score for the Titanic competition.
Precision
Precision (P) is the ratio of correct positive predictions to all positive predictions:
For the Titanic: of the passengers predicted to have survived, how many actually survived?
Recall
Recall (R) is the ratio of correct positive predictions to all actual positives:
For the Titanic: of all the passengers who actually survived, how many were predicted to survive?
Both share the same numerator, TP. What differs is what they divide by — precision reads down the Predicted True column, recall reads across the Actual True row:
| Predicted True | Predicted False | ||
|---|---|---|---|
| Actual True | TP | FN | ← Recall = TP / (TP + FN) |
| Actual False | FP | TN | |
| ↑ Precision = TP / (TP + FP) |
- Precision asks: of everything the model called positive (the column), how much really was?
- Recall asks: of everything that really was positive (the row), how much did the model catch?
See the scikit-learn precision-recall example for more.
F1 Score
The F1 score combines the precision and recall of a classifier into a single metric by taking their harmonic mean:
The harmonic mean gives less weight to large values and more weight to small values, which balances them out. As a result, the F1 score is higher for models with balanced precision and recall — a model with high precision but low recall tends to have a lower F1 score.
F1 is the harmonic mean of just two numbers, precision P and recall R, so n = 2. Multiplying the top and the bottom by P × R gives the form you usually see:
Precision and Recall Exercise
Positive means Survived, negative means Died. A model produced this confusion matrix:
| Actual \ Predicted | Predicted Survived | Predicted Died |
|---|---|---|
| Actually Survived | 36 (TP) | 38 (FN) |
| Actually Died | 19 (FP) | 86 (TN) |
- TP (36): 36 people predicted to survive actually survived
- TN (86): 86 people predicted to die actually died
- FP (19): 19 people predicted to survive actually died
- FN (38): 38 people predicted to die actually survived
Calculate and interpret precision and recall:
- Precision is 36 / (36 + 19) = 0.655
- Recall is 36 / (36 + 38) = 36 / 74 = 0.486
- F1 is 2 × (0.655 × 0.486) / (0.655 + 0.486) = 0.558
Uneven Costs of Two Types of Prediction Errors
In many applications, the two types of errors have different costs:
- wrongly diagnosing an ill patient as normal costs a lot more than wrongly diagnosing a healthy person as ill
- wrongly approving a credit card application costs a lot more than wrongly denying one
- wrongly filtering out a good email costs a lot more than wrongly letting a spam through
Evaluate a Model Using Total Cost
Here are the confusion matrices of two models on the same 15 instances:
Model 1
| Actual \ Predicted | + | − |
|---|---|---|
| + | 3 | 3 (FN) |
| − | 2 (FP) | 7 |
Model 2
| Actual \ Predicted | + | − |
|---|---|---|
| + | 3 | 1 (FN) |
| − | 4 (FP) | 7 |
Both models have the same accuracy: 10 / 15 = 0.667.
With equal cost — Cost(FP) = $5, Cost(FN) = $5:
- Total cost of model 1 = 2 × 5 + 3 × 5 = $25
- Total cost of model 2 = 4 × 5 + 1 × 5 = $25
With uneven cost — Cost(FP) = $5, Cost(FN) = $20 (such as cancer detection):
- Total cost of model 1 = 2 × 5 + 3 × 20 = $70
- Total cost of model 2 = 4 × 5 + 1 × 20 = $40
Accuracy cannot tell the two models apart, but once errors carry different costs, model 2 is clearly better.
Evaluate without Kaggle?
- In the current process, you don't know your model's performance until you upload your predictions to Kaggle and see the score.
- How can we know our model's performance (score) without going to Kaggle?
- In real projects, you don't have a place like Kaggle to test your model anyway.
Holdout Validation
- Split the dataset into train and test (like Kaggle).
- Hold out a portion of the train dataset as the validation set.
- Use the remaining train data to train the model, and evaluate the model on the validation set.
- Finally, use the test set to evaluate the model.
Problems:
- What if, by accident, a particularly easy or hard validation set is selected?
- Holding out a separate set reduces the number of samples used to learn the model.
K-Fold Cross Validation
Start again from the train/test split, and work only inside the train part:
- The train dataset is divided into K folds.
- K − 1 folds are used to train, and the remaining fold is used to validate.
- Repeat K times, so each fold is the validation fold once, and use the average evaluation result.
- Cross validation is for model checking (tuning parameters, comparing models), not for model building. Once we find the best model, we use ALL the training data to train the final model and evaluate it on the test set.
How to Use the Test Set
The validation set and cross validation are for choosing a model. The test set is for answering one question about the model you already chose: how well will it do on data it has never seen? Ideally you look at it once.
The test score is for:
- Reporting — the number you give the business: "expect about this accuracy on next season's data." The cross validation score cannot play this role, because you used it to pick the winner, which makes it slightly optimistic.
- Checking — if the test score lands close to the cross validation score, your evaluation worked. If it is far below, something is wrong, such as a mistake in the split.
- Deciding — is the model good enough to deploy? Does it beat the simple rule you had before? That is a yes-or-no decision about one model, not a choice between models.
The test score is not for choosing between models or settings. Suppose you try five settings and keep whichever scores best on the test set: some of that score is luck on those particular rows, so the winner's score is too high, and there is no data left to check the choice. Once the test set has helped you choose, it has become a validation set.
If the test score disappoints you, you can go back and improve the model — but that test score is now spent. If you change the model, you need a new honest number. In order of preference:
- New data. Data collected after the model was built — next season's data — is the only truly untouched test. In practice this is what deploying carefully means: run the new model on a small share of real cases first and measure it on the real outcomes.
- Set aside a second test set at the start. Teams that expect to iterate hold back a final set they promise to open only once, at the very end. It costs data, but it guarantees one clean number.
- Reuse the old test set and say so. A second look adds only a small bias; what inflates the score is looking many times and keeping the best. It is acceptable to report "0.79, measured on a test set we have looked at twice, so slightly optimistic".
After the test, the model you deploy is usually refit on all the data, test rows included, because more data gives a slightly better model. The test score you already have is the estimate you report for it.
Kaggle builds this rule in. During a competition the leaderboard is scored on public rows, but final ranks come from private rows nobody sees until the end. Teams that submit over and over end up choosing their model by the public score — the same mistake as reusing a test set — and often drop in the final ranking when the private scores are revealed.
Overfitting and Underfitting
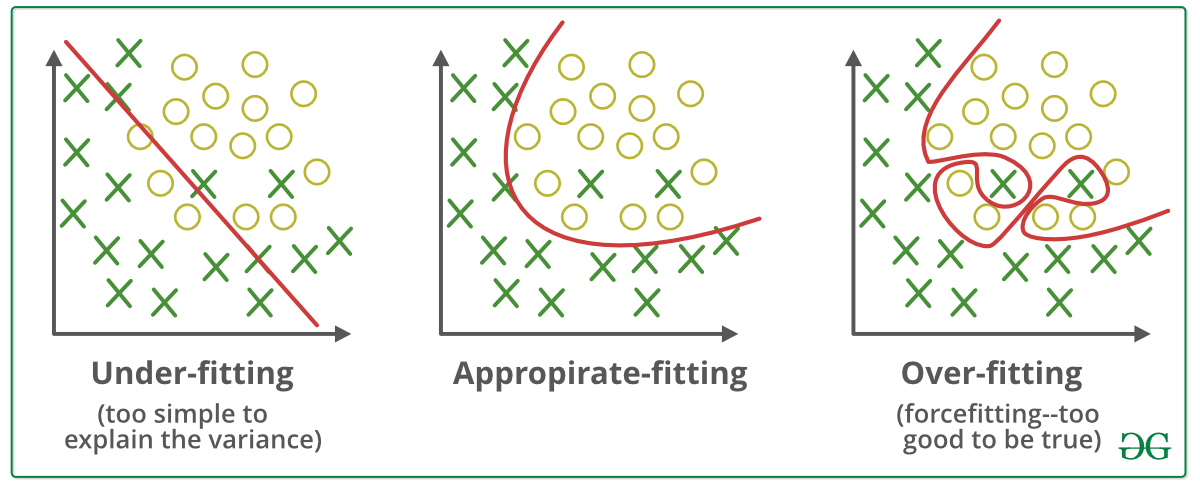
- Underfitting happens when the model cannot capture the underlying patterns of the data and therefore has limited prediction power.
- Overfitting happens when the model corresponds too closely or exactly to a particular set of data and may fail to reliably predict future new, unseen data.
Sources: Wikipedia: Overfitting, GeeksforGeeks: Underfitting and Overfitting
Remedies for Overfitting and Underfitting
Underfitting — detection: low performance on the training data.
- Get more data
- Add more features
- Use more sophisticated models
Overfitting — detection: high performance on the training data, low performance on the test data.
- Cross validation
- Remove features
- Regularization (techniques that force the model to be simpler, e.g., pruning a decision tree)
- Early stopping
Remember the huge, complicated tree we plotted in Decision Tree Prediction? That is what overfitting looks like, and limiting the tree's depth (pruning) is the remedy.
Model Evaluation
How good is a model before Kaggle tells you? We first cover the measures behind the score and how to estimate it yourself with validation, then put them to…
Model Evaluation and Selection
NOTE: In order to keep this demonstration code simple, we only choose three numerical features to train the model to avoid the tedious categorical feature…