
Clustering
-
Supervised Learning: we have labeled target we want to predict, such as survival, churn, house price, etc.
- Classification
- Regression
-
Unsupervised learning: the data is not labeled
- Clustering: group similar instances together into clusters
- Association: find relationships between variables, such as “customers who bought this also bought that”
- Dimensionality reduction: reduce the number of features while preserving the data integrity.
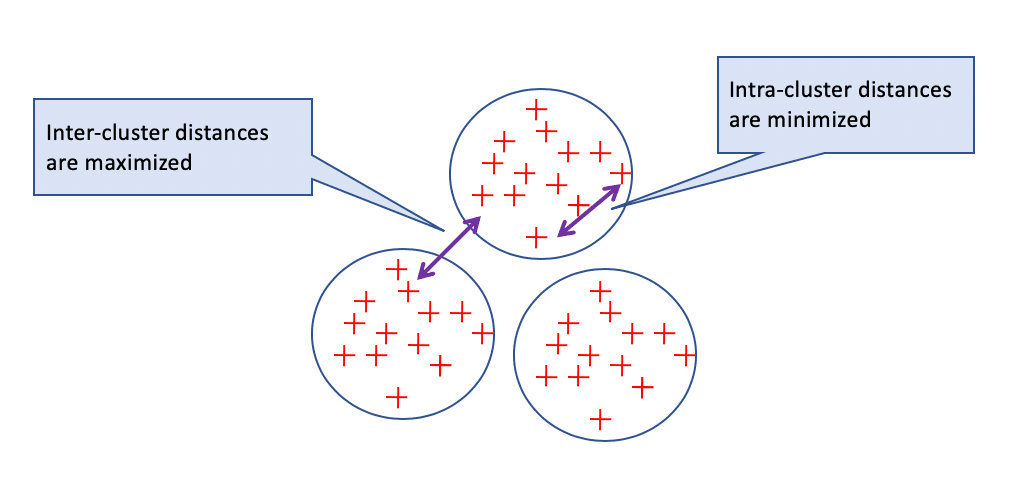
The intuition of the clustering algorithm is quite simple - it is trying to achieve:
-
Maximum similarity between records within a cluster
-
Maximum dissimilarity between records of different clusters
K-Means Algorithm
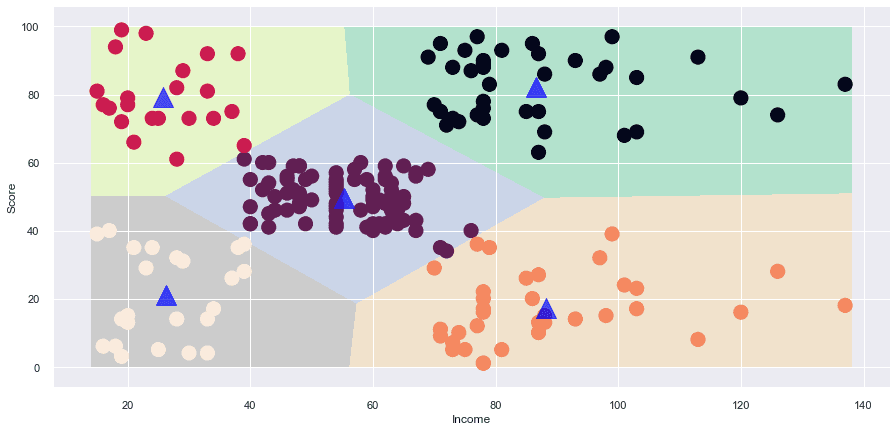
K-means clustering is a center-based clustering method that groups the data points in k exclusive clusters.
- Each cluster is represented by a central data instance, called Centroid (the blue triangles below)
- Each data instance belongs to one exclusive cluster
A Voronoi Diagram for K-Means Clustering Result:
Centroid
Centroid is essentially the "mean" of the data points, therefore K-Means
import matplotlib.pyplot as plt
plt.style.use('seaborn')
# Centroid is essentially the "mean" of the data points, therefore K-Means
fig, ax = plt.subplots()
ax.plot(1, 2, 'o', markersize=10)
ax.plot(3, 4, 'o', markersize=10)
ax.plot(4, 3, 'o', markersize=10)
ax.plot((1+3+4)/3, (2+4+3)/3, '^', markersize=15) # the centroid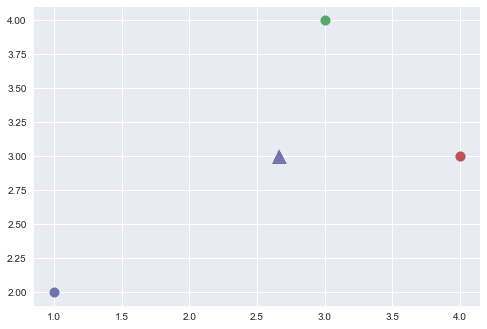
Distance Metrics
Different metrics can be used to measure the distance among data points, such as the Manhattan Distance and Euclidean Distance.
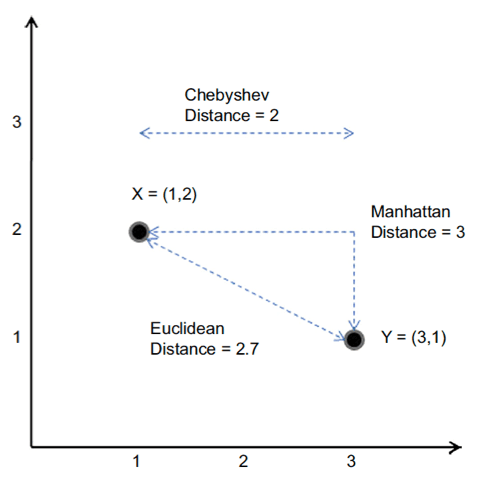
In Cartesian coordinates, if and are two points in Euclidean n-space, then the Euclidean distance () from to is given by following formula:
See more at https://en.wikipedia.org/wiki/Euclidean_distance
Key Steps of K-Means Algorithm
Step 1: Initiate k random centroids (k specified by the user, which is 3 in the following example)
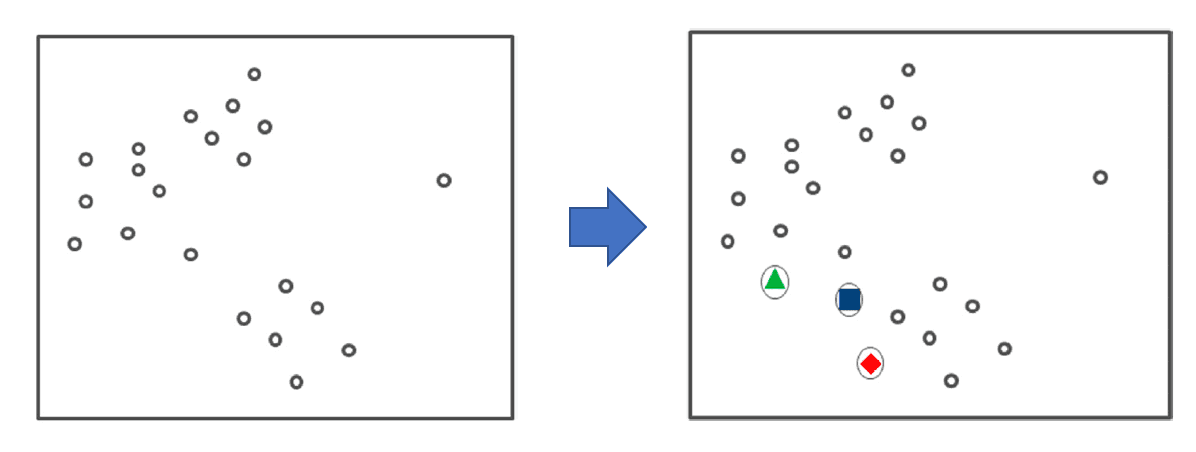
Step 2: Assign data points to the nearest centroid to form a cluster
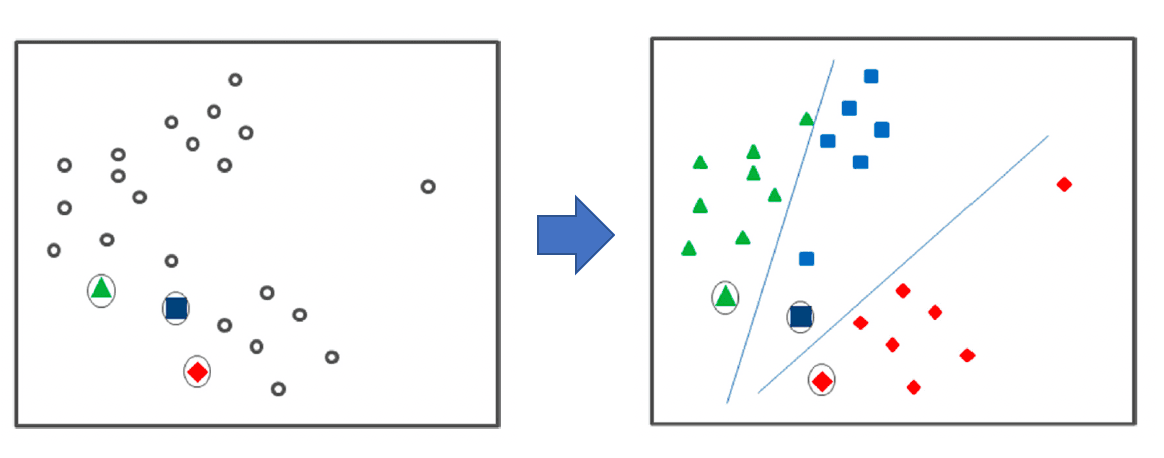
Step 3: Calculate the new centroids for each cluster
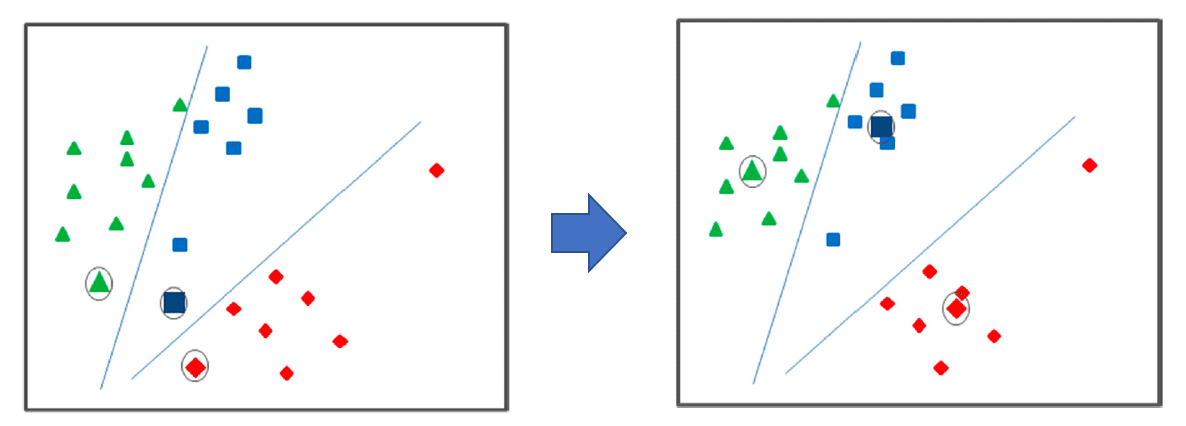
Step 4: Repeat assignment to the new centroids. Assign data points to the nearest new centroid to form a cluster
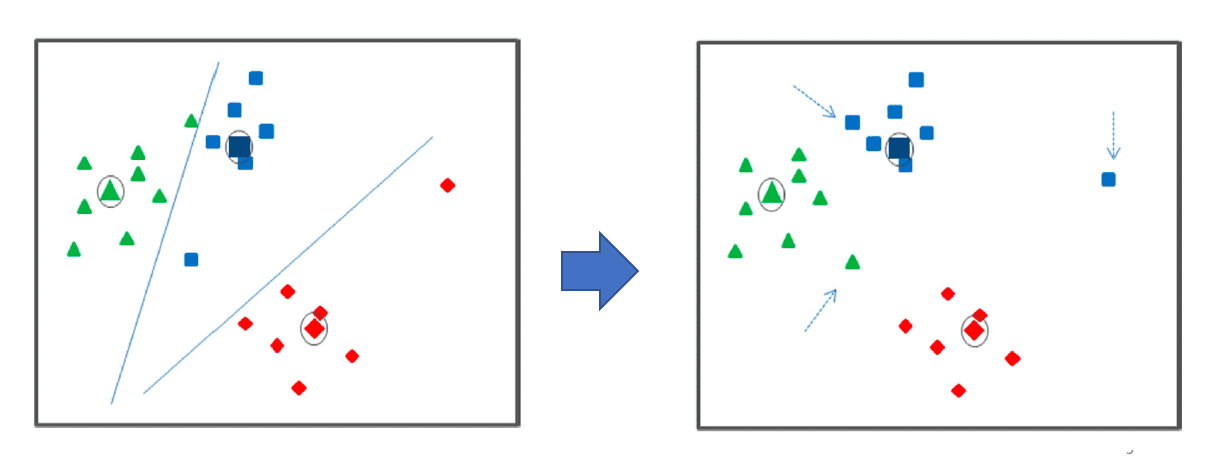
Step 5: Repeat Steps 3 and 4 until no further change in data point assignments
[Source]
Smarter Initialization
Instead of random assigning the initial centroids as discussed above, a smarter initialization algorithm was proposed in K-Means++, which tends to select centroids that are distant from one another and is able to speed up the convergence of K-Means. K-means++ is the default initialization algorithm in Scikit-Learn.
Evaluation Metric
- How do we know what K value to choose?
- How do we compare different clustering solutions?
Inertia
The evaluation metric is called inertia, which is the sum of mean squared distance between each instance and its closest centroid.
The smaller the inertia the denser the cluster (the points in the same cluster are closer to each other) and the K-means algorithm aims to minimize inertia.
More formally, the k-means algorithm divides a set of n samples X into disjoint k clusters C, each described by the mean (centroid) of the cluster.
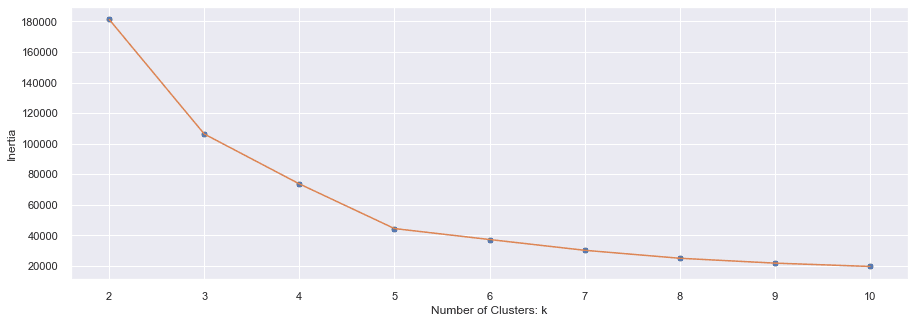
We then try a number of K values and plot the corresponding inertia and choose the value at the "elbow" of the plot.
Silhouette Score (Optional)
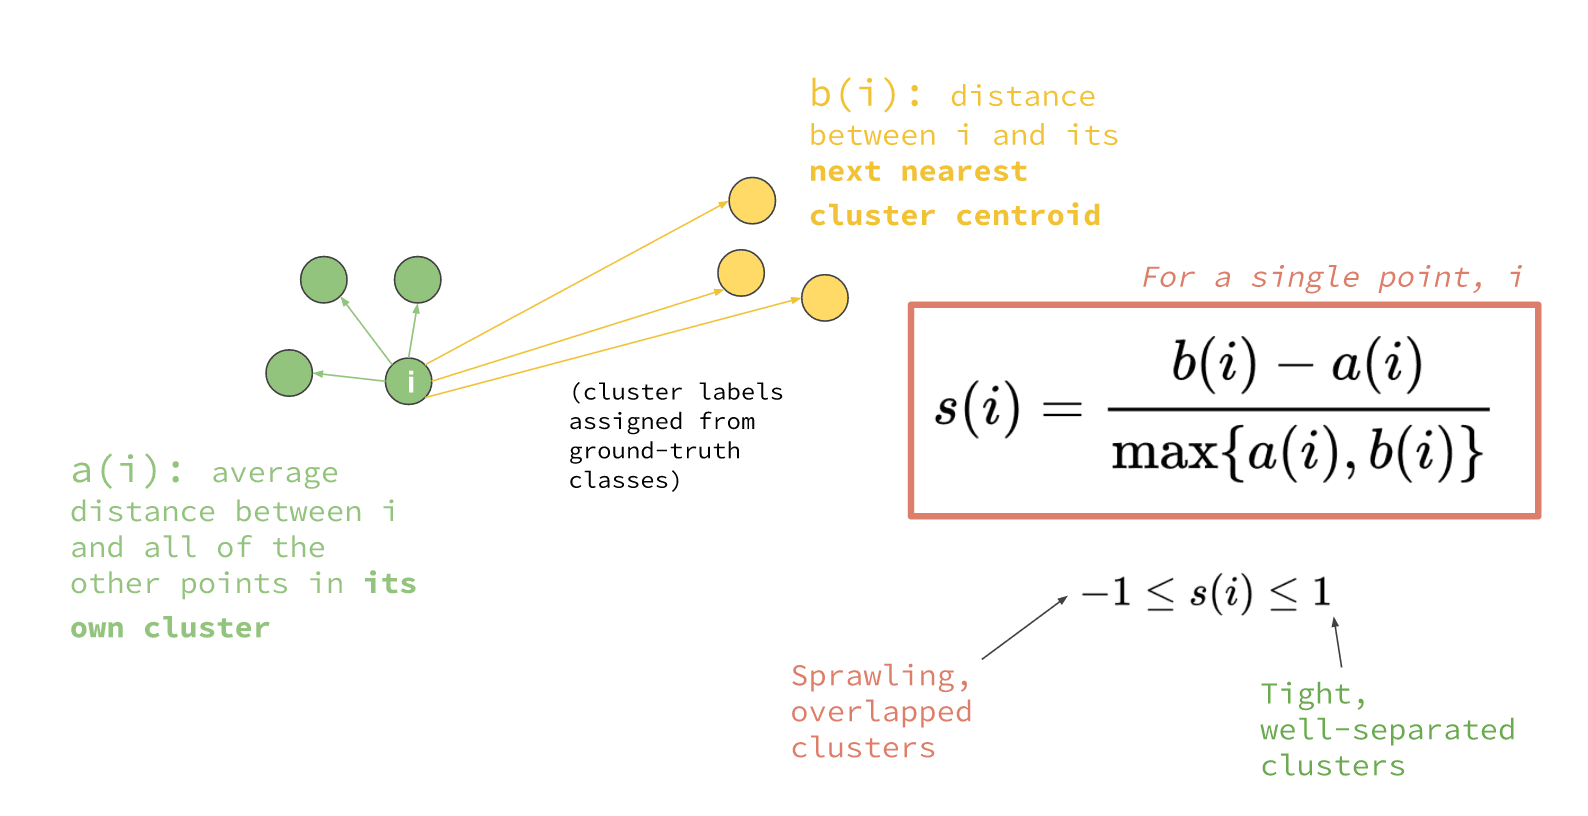
The silhouette value is a measure of how similar an object is to its own cluster (cohesion) compared to other clusters (separation).
For each data point , let
-
is the mean distance between i and all other points in the same cluster.
-
is the mean distance between i and all points its closest (therefore the nin here) neighboring cluster.
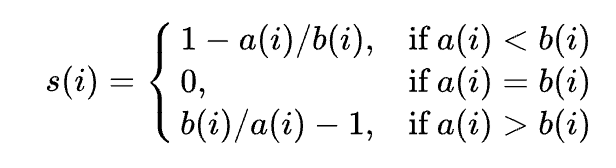
The Silhouette Score is:
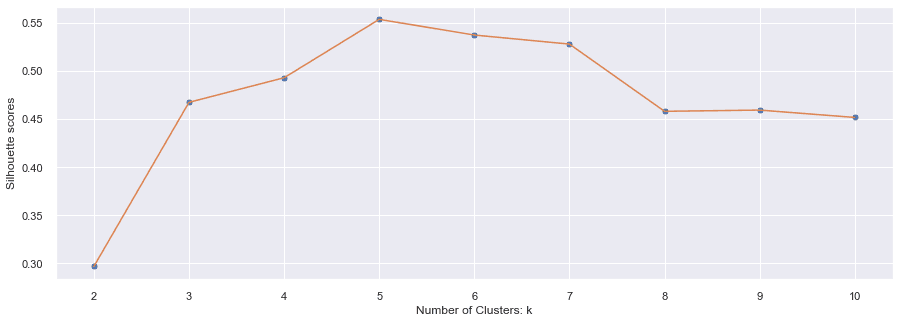
From the following silhouette score plot, you can clearly see that k=5 is the best.
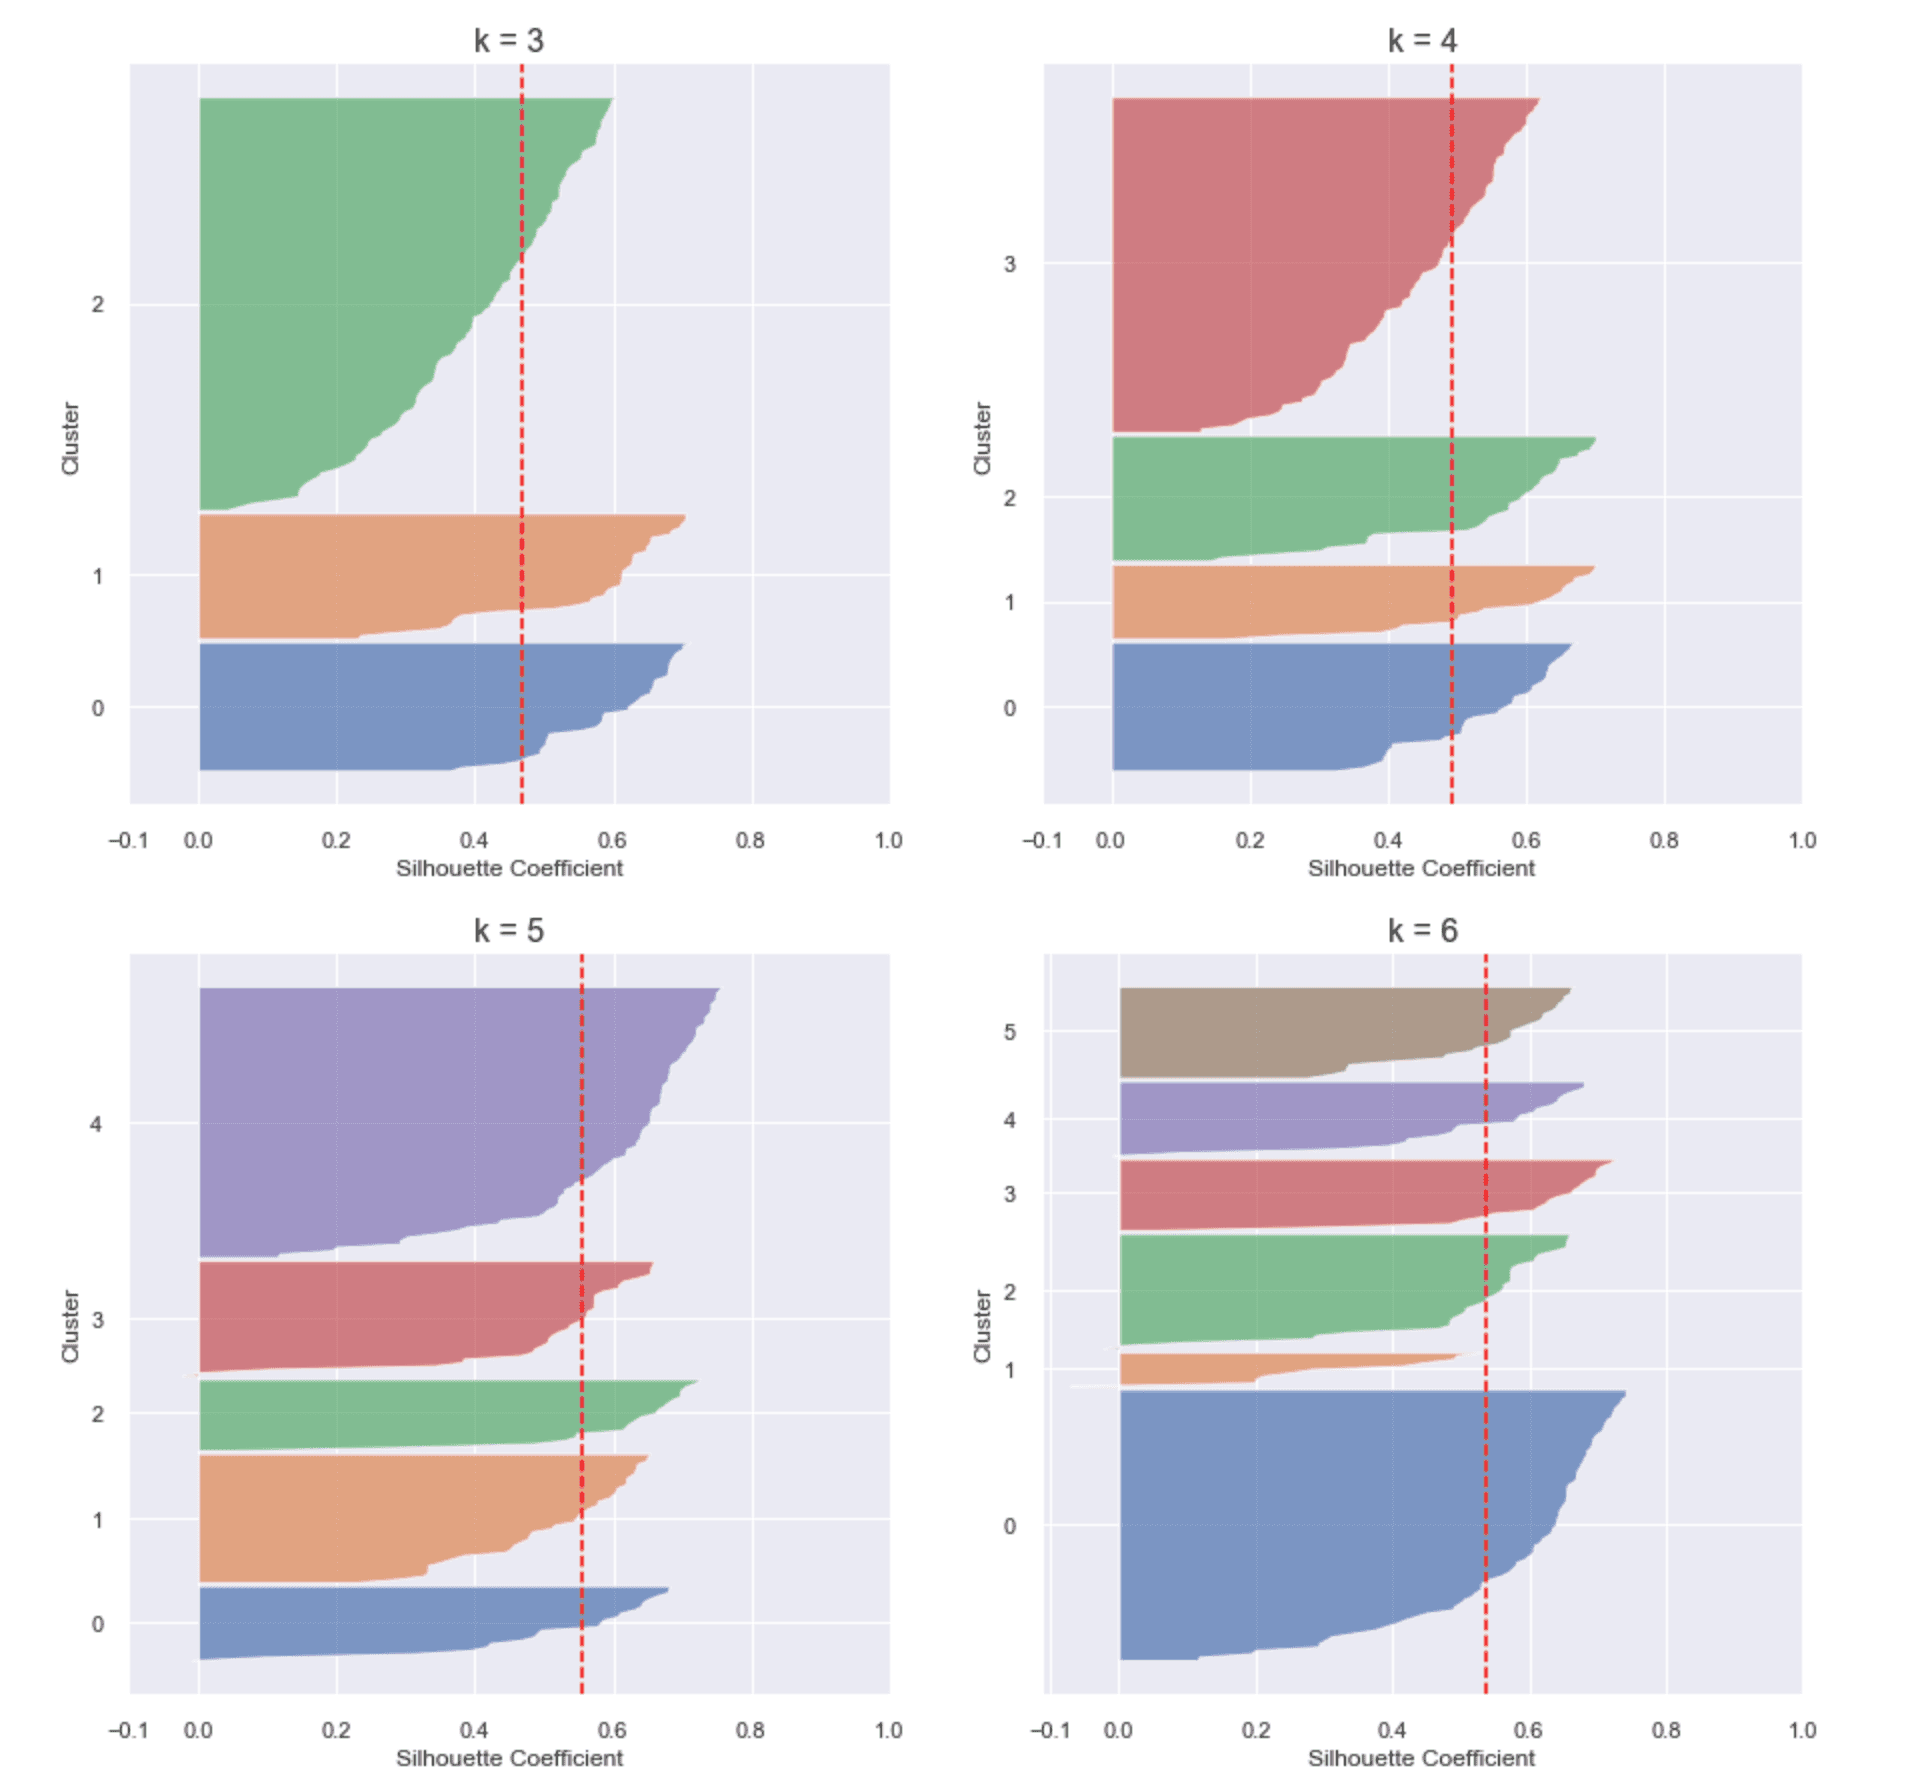
If you plot the silhouette score for each data instance within each cluster, you get the silhouette diagram as shown blow (each cluster is a sort of "silhouette").
This is how you read Silhouette Diagram:
-
best silhouette score for each data point is 1, so the "longer" the silhouette, the better
-
the red line is the mean silhouette for the k value, it's bad for a silhouette not reaching the red line, which means the points in that cluster should belong to other clusters
-
it's better to have silhouette with similar sizes, which means the data points are more evenly clustered
Ensemble Learning
The general idea of boosting is to train predictors sequentially using all data, each trying to correct its predecessor.
Customer Segmentation Analysis
In this example, we are going to conduct a simple customer segmentation analysis using K-Means algorithm. The data is about the customers of a shopping…