Model Evaluation and Selection
- Build three decision tree models with different parameters
- Compare their performance using 10-fold cross validation (we also look at the train/test performance for each model to look for overfitting)
- Select the best model and use the corresponding parameters to train the final model using ALL training data
- Evaluate the final model on the test set and plot the confusion matrix
# import the packages
import pandas as pd
import matplotlib.pyplot as plt
plt.style.use('ggplot')

# read the titanic train dataset
df = pd.read_csv('titanic.csv')
df.info()NOTE: In order to keep this demonstration code simple, we only choose three numerical features to train the model to avoid the tedious categorical feature encoding (one-hot encoding) - so the model performance won’t be good - focus on the workflow not the performance for this lecture. You should always use all important features in your real project.
# specify features and target
X = df[['SibSp', 'Parch', 'Fare']]
y = df['Survived']
Then, we split the data into a training set and a testing set. We choose to use 20% (test_size=0.2) of the data set as the test set. The dataset is randomized first and then splitted.
Fix the random_state ensures everyone running the code sees the same splitting result.
# Any number for the random_state is fine
# see 42: [https://en.wikipedia.org/wiki/42_(number)](https://en.wikipedia.org/wiki/42_(number))

from sklearn.model_selection import train_test_split
X_train, X_test, y_train, y_test = train_test_split(X, y, test_size=0.2, random_state=42)
Now, let’s initialize three decision tree models with different parameters:
from sklearn.tree import DecisionTreeClassifier

tree_clf1 = DecisionTreeClassifier(criterion='entropy')
tree_clf2 = DecisionTreeClassifier(criterion='entropy', max_depth=3)
tree_clf3 = DecisionTreeClassifier(criterion='gini', max_depth=6)
Next, we evaluate the performance of the three models using 5-fold cross validation (each model is trained and tested 5 times using different folds of the training data - 5 passes in total)
return_train_score=True also returns the training score for each pass, which is optional
from sklearn.model_selection import cross_validate

metrics = ['accuracy', 'precision', 'recall', 'f1']

tree_clf1_scores = cross_validate(tree_clf1, X_train, y_train, scoring=metrics, cv=5, return_train_score=True)
tree_clf2_scores = cross_validate(tree_clf2, X_train, y_train, scoring=metrics, cv=5, return_train_score=True)
tree_clf3_scores = cross_validate(tree_clf3, X_train, y_train, scoring=metrics, cv=5, return_train_score=True)
Print out tree_clf1_scores you should see the following, which is a dictionary:
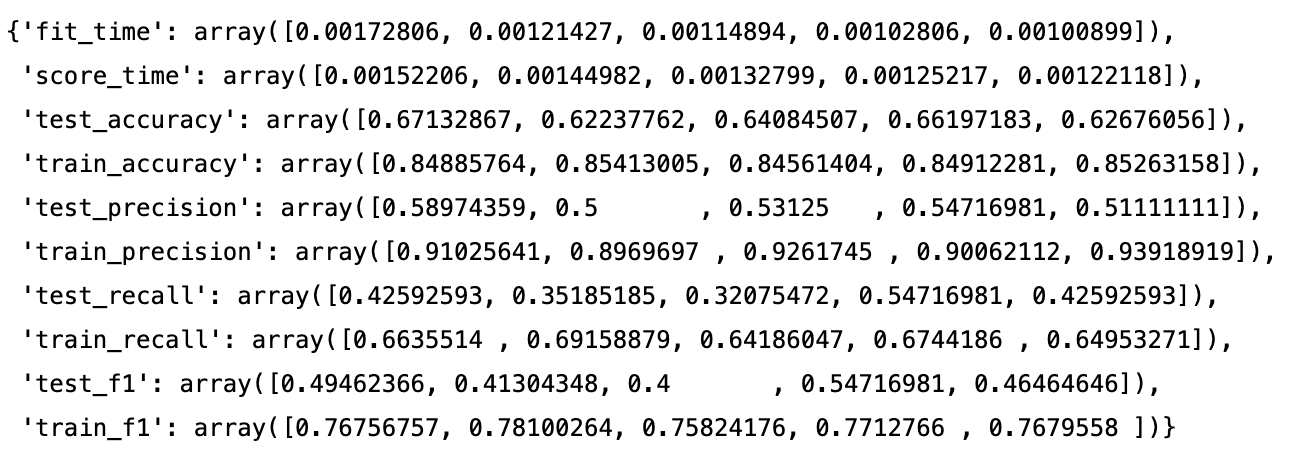
Let’s plot the training/testing accuracy for three models. We can see that model 1 clearly has overfitting problem, i.e., the training accuracy is significantly higher than the testing accuracy!!!
fig, ax = plt.subplots(1, 3, figsize=(20, 5))

ax[0].plot(tree_clf1_scores['train_accuracy'])
ax[0].plot(tree_clf1_scores['test_accuracy'])

ax[1].plot(tree_clf2_scores['train_accuracy'])
ax[1].plot(tree_clf2_scores['test_accuracy'])

ax[2].plot(tree_clf3_scores['train_accuracy'])
ax[2].plot(tree_clf3_scores['test_accuracy'])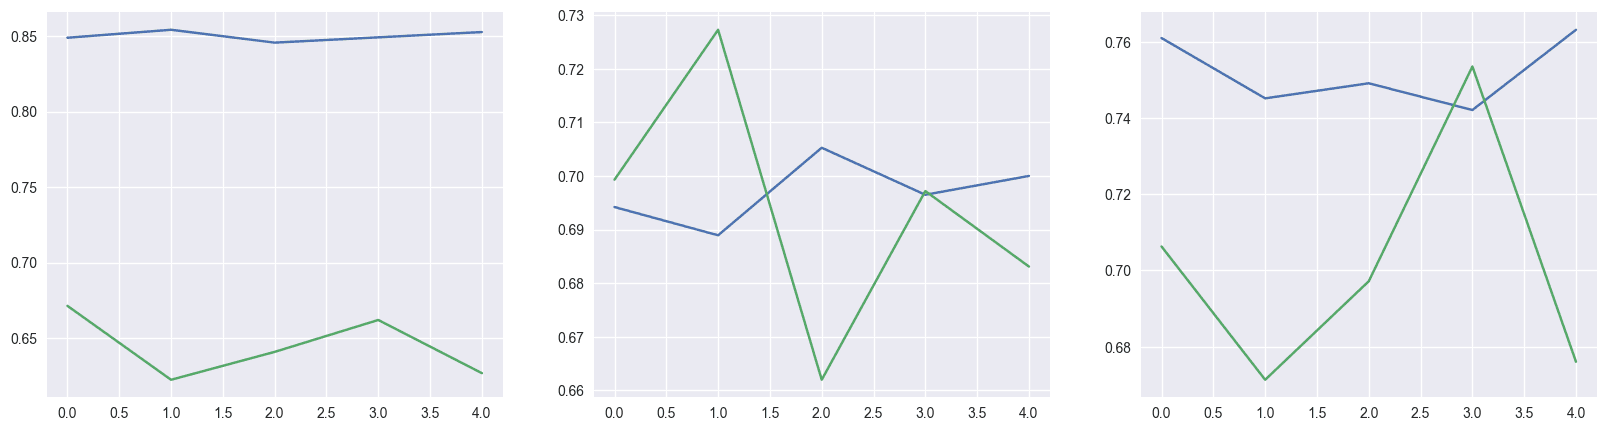
We can also compare their average accuracy (or precision/recall/f1):
print('Tree 1 average accuracy score:', tree_clf1_scores['test_accuracy'].mean())
print('Tree 2 average accuracy score:', tree_clf2_scores['test_accuracy'].mean())
print('Tree 3 average accuracy score:', tree_clf3_scores['test_accuracy'].mean())
In terms of accuracy, model 3 is the best. Let’s choose model 3 and use it’s parameter to train the final model using ALL training data (remember, we only used 80% of the training data in the 5-fold CV) and test it on the testing data (which has NEVER been used in training)
Pause here and think again about why we need to train model 3 using ALL training data
We can see that the test accuracy is slightly higher than the CV accuracy.
# we train the final model using ALL training data
tree_clf3.fit(X_train, y_train)

# get the prediction results from the testing set
y_pred = tree_clf3.predict(X_test)

# calculate accuracy, precision, recall, f1-score
# Note: y_test is the ground truth for the tesing set
# we have similiar score for the test set as the cross validation score - good
from sklearn.metrics import accuracy_score, recall_score, precision_score, f1_score

print(f'Accuracy Score : {accuracy_score(y_test, y_pred)}')
print(f'Precision Score : {precision_score(y_test, y_pred)}')
print(f'Recall Score : {recall_score(y_test, y_pred)}')
print(f'F1 Score : {f1_score(y_test, y_pred)}')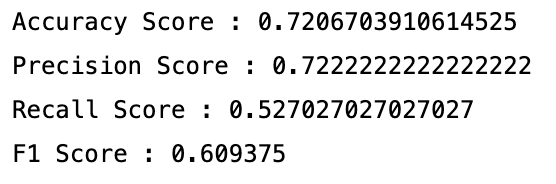
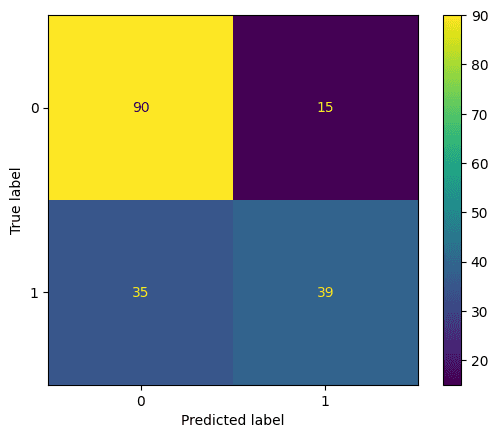
We can also plot the confusion matrix based on the testing result:
plt.style.use('default') # use default style for confusion matrix plots

from sklearn.metrics import ConfusionMatrixDisplay
ConfusionMatrixDisplay.from_estimator(tree_clf3, X_test, y_test)