
Data App Tutorial
streamlit application
Before the lesson
1.You need to create an account at https://share.streamlit.io/signup
- Download the file below
If you don’t have copilot agent, download the file below
3.Install the packages.
There is nothing to activate — run every command from your ml4biz project folder and uv uses the project environment automatically.
cd ~/ml4biz
uv add streamlit matplotlib seaborn
Content of lesson
World Cities App
Single page
my project:https://www.loom.com/share/5ebdae83932f4dc797e8ab5b2e510739
streamlit gallery:https://streamlit.io/gallery
make sure you unzip the world-cities.zip file
we will use a world cities dataset to learn more about streamlit, you can see the final app at https://share.streamlit.io/harrywang/world-cities/main/app-cities.py (失效了)
uv init --python 3.14 my-streamlit
cd my-streamlit
uv add -r requirements.txt
First, you need to download the load world cities dataset to my-streamlit folder created above.
The dataset is revised based on this Kaggle Dataset.
Create a new notebook cities.ipynb to analyze the dataset first:
import pandas as pd
import matplotlib.pyplot as plt
import seaborn as sns
sns.set()

df = pd.read_csv('worldcities.csv')
df.head()
Statistics about the population, which we will use to make a slider:
df.population.describe()

Output:
count    723.000000
mean       3.610043
std        4.029683
min        1.001205
25%        1.335808
50%        2.150000
75%        4.377700
max       37.977000
Name: population, dtype: float64
The capital column has the following values, which we will use to make a multi-select:
- primary - country's capital (e.g. Washington D.C.)
- admin - first-level admin capital (e.g. Little Rock, AR)
- minor - lower-level admin capital (e.g. Fayetteville, AR)
- nan if not a capital (nan is not a string - it’s a keyword in Pandas for Null)
df.capital.unique()

Output:
array(['primary', 'admin', nan, 'minor'], dtype=object)
We can plot the population by country as follows:
fig, ax = plt.subplots(figsize=(20, 5))
pop_sum = df.groupby('country')['population'].sum()
pop_sum.plot.bar(ax=ax)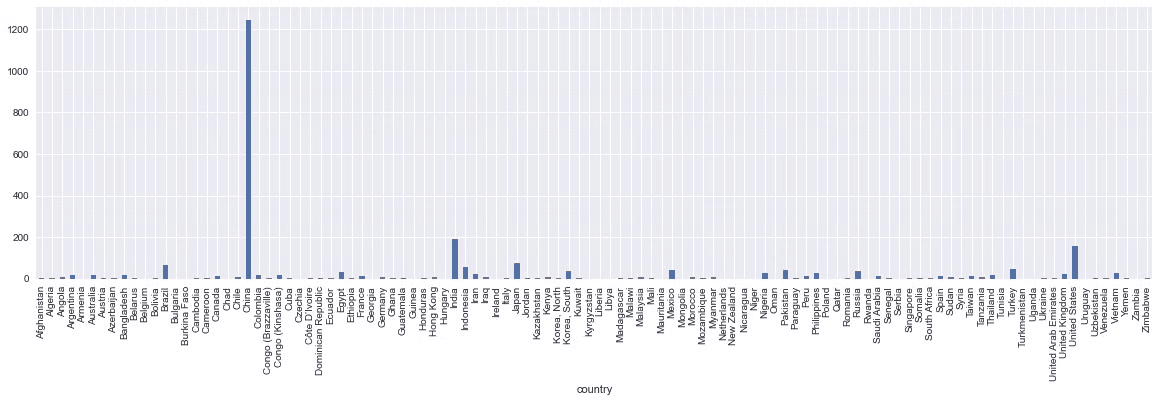
Create a new app-cities.py file with the following content, which is explained next:
import streamlit as st
import pandas as pd
import matplotlib.pyplot as plt
plt.style.use('seaborn')

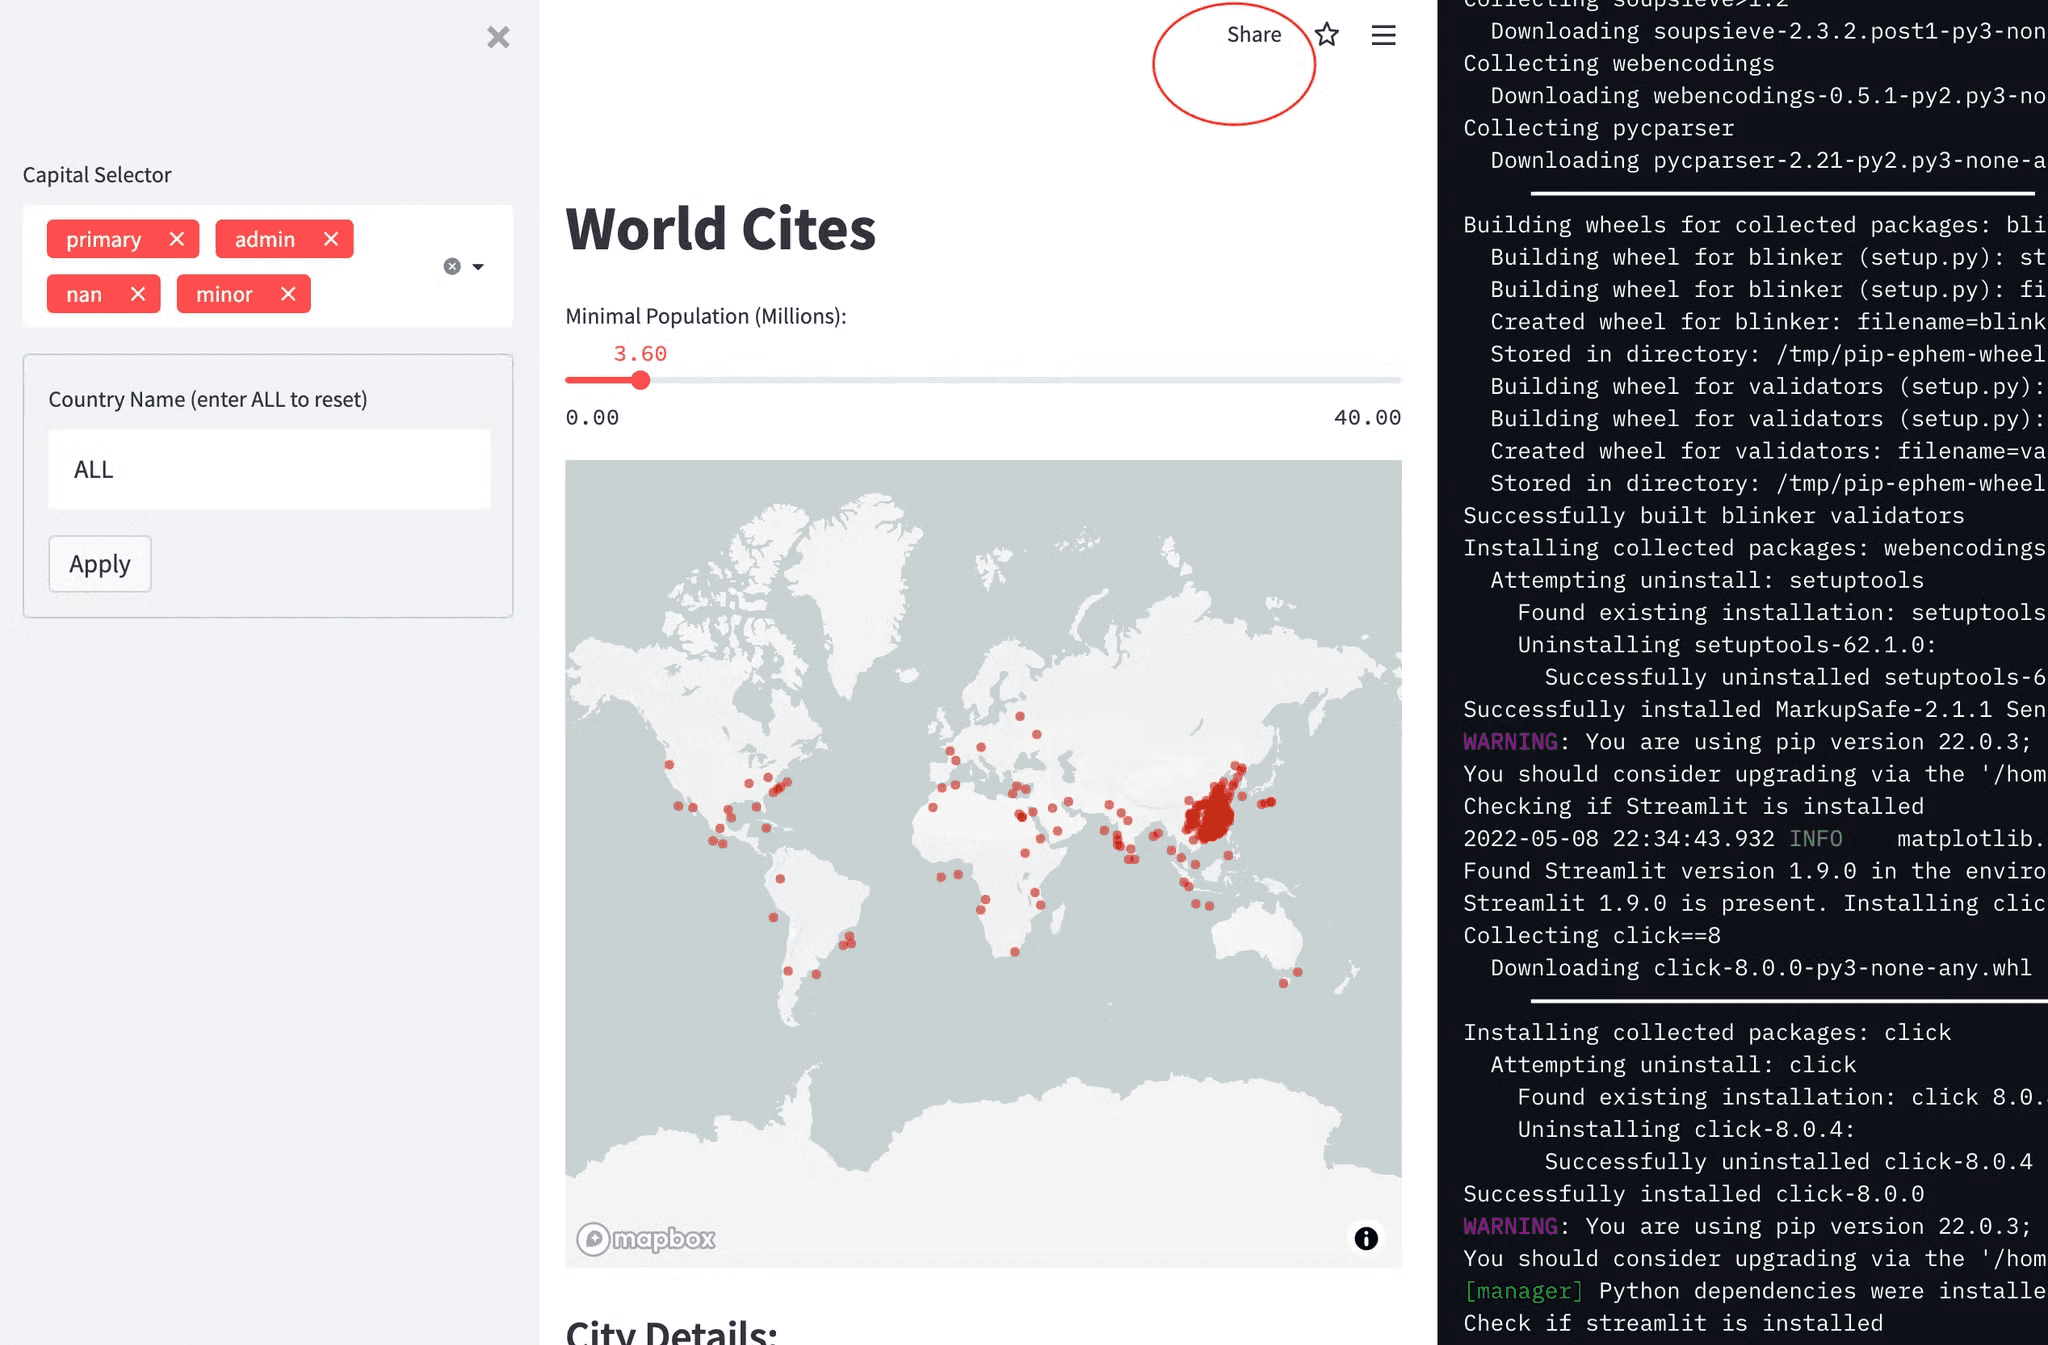
st.title('World Cites')
df = pd.read_csv('worldcities.csv')

# note that you have to use 0.0 and 40.0 given that the data type of population is float
population_filter = st.slider('Minimal Population (Millions):', 0.0, 40.0, 3.6)  # min, max, default

# create a multi select
capital_filter = st.sidebar.multiselect(
     'Capital Selector',
     df.capital.unique(),  # options
     df.capital.unique())  # defaults

# create a input form
form = st.sidebar.form("country_form")
country_filter = form.text_input('Country Name (enter ALL to reset)', 'ALL')
form.form_submit_button("Apply")

# filter by population
df = df[df.population >= population_filter]

# filter by capital
df = df[df.capital.isin(capital_filter)]

if country_filter!='ALL':
    df = df[df.country == country_filter]

# show on map
st.map(df)

# show dataframe
st.subheader('City Details:')
st.write(df[['city', 'country', 'population']])

# show the plot
st.subheader('Total Population By Country')
fig, ax = plt.subplots(figsize=(20, 5))
pop_sum = df.groupby('country')['population'].sum()
pop_sum.plot.bar(ax=ax)
st.pyplot(fig)NOTE: whenever you interact with the app using any widget, such as changing the slider's value, the ENTIRE file is executed again from top to bottom.
- title, subtitle using
st.title()andst.subheader() - show the map using
st.map()the dataframe must have columns namedlatitudeorlatandlongitudeorlon - create a slider using
st.slider() - create a multi-select using
st.multiselect() - put widgets in sidebar using
st.sidebarsuch asst.sidebar.multiselect() - use
st.form()to group multiple widgets and only refresh the app when the form button is clicked, see the country filter as an example
You can run the app: uv run streamlit run app.py
Deploy App
In order to deploy the app to Streamlit Cloud, you need to create two accounts:
- Create a Github account (done in the previous lab) : https://docs.github.com/en/get-started/signing-up-for-github/signing-up-for-a-new-github-account
- Create a Streamlit cloud account using the Github account: https://share.streamlit.io/signup
Basically, you need to upload the Streamlit files to Github and then deploy the app to Streamlit Cloud.
We will use Github Desktop to do this.
Login and choose the following option:
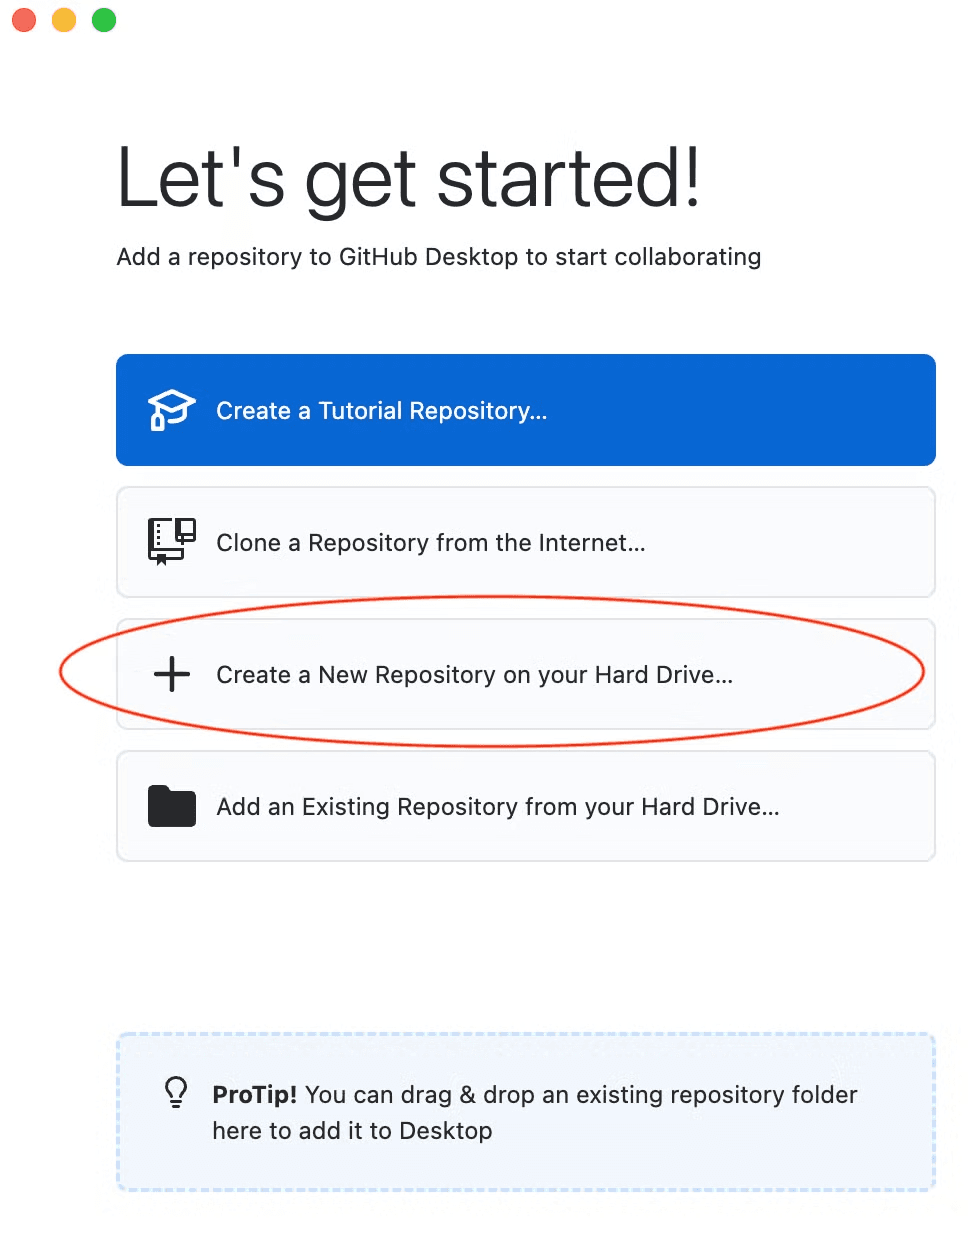
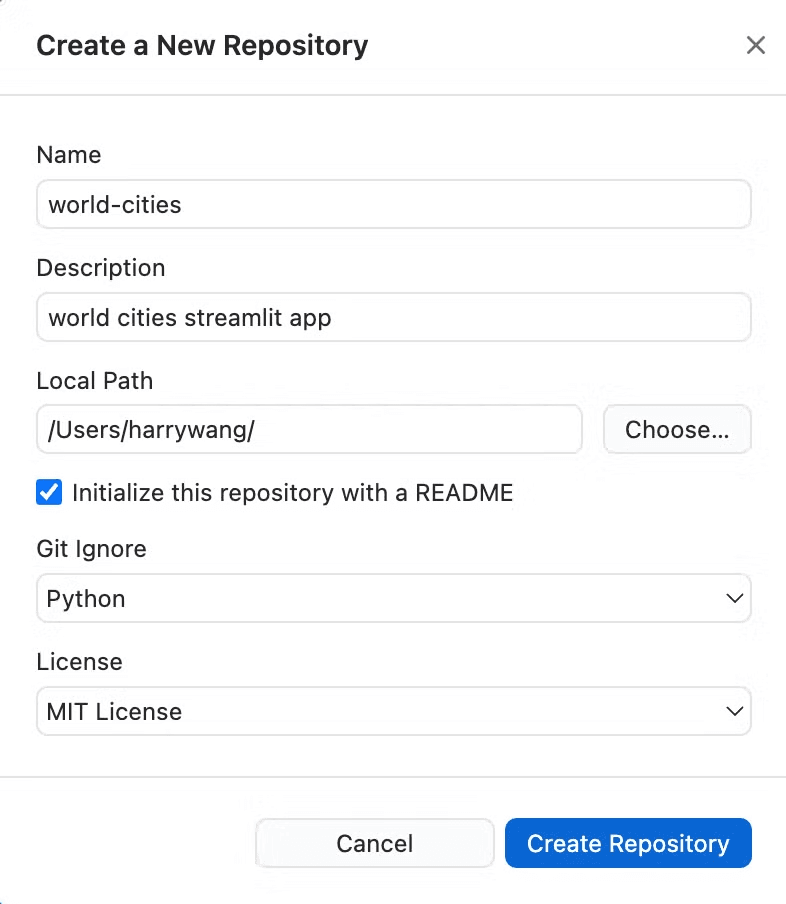
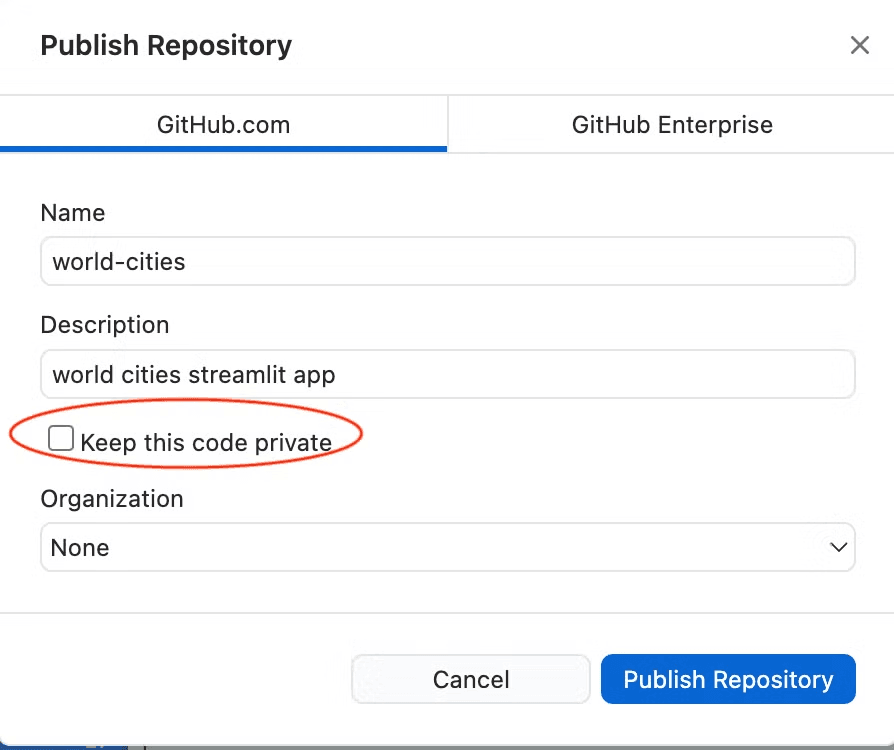
then, enter the following information - you may change the path and folder name based on your own needs:
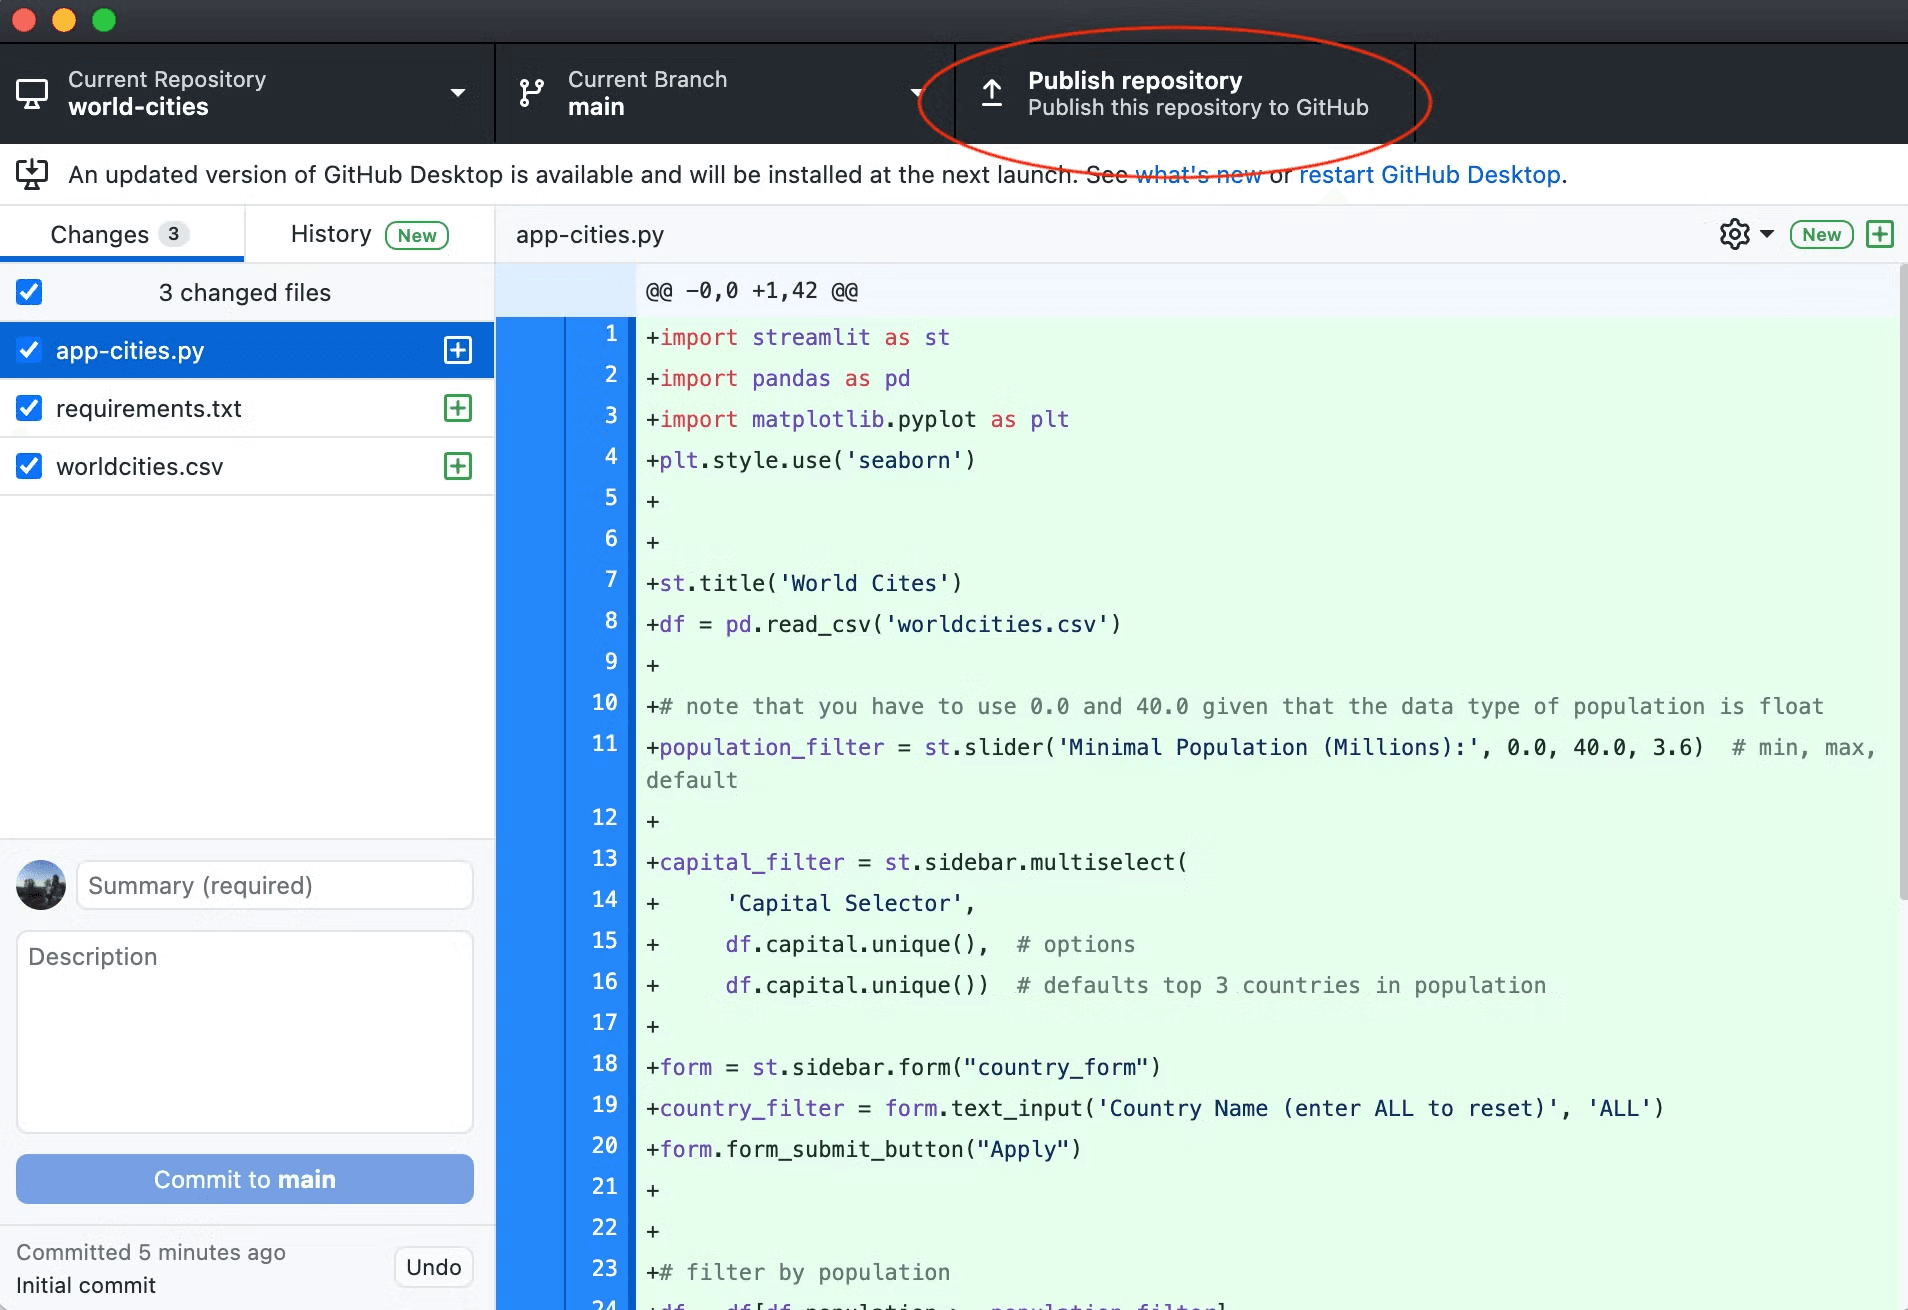
Then, publish the repository to Github:
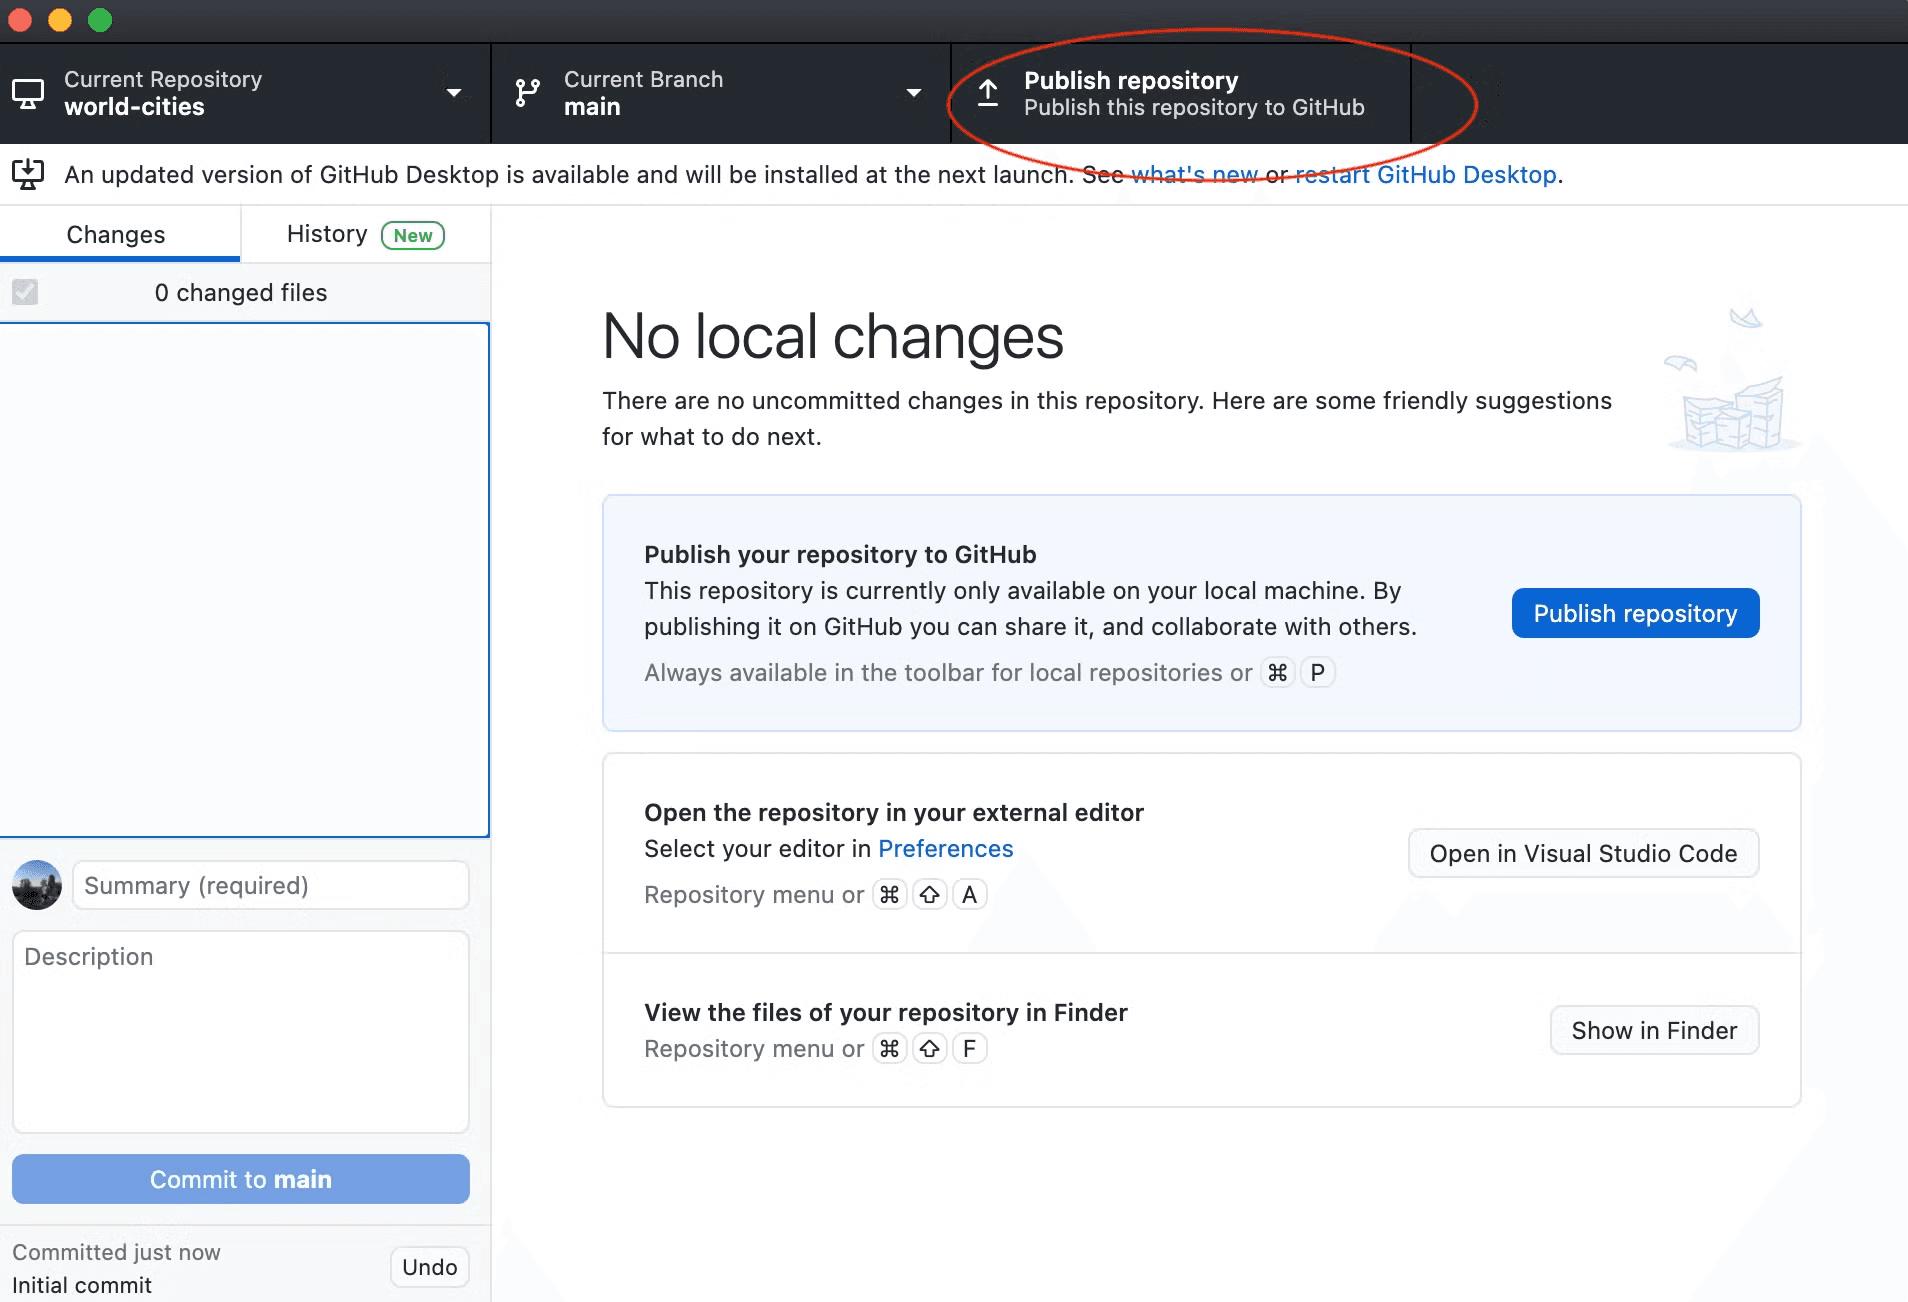
Make sure the repository must be PUBLIC
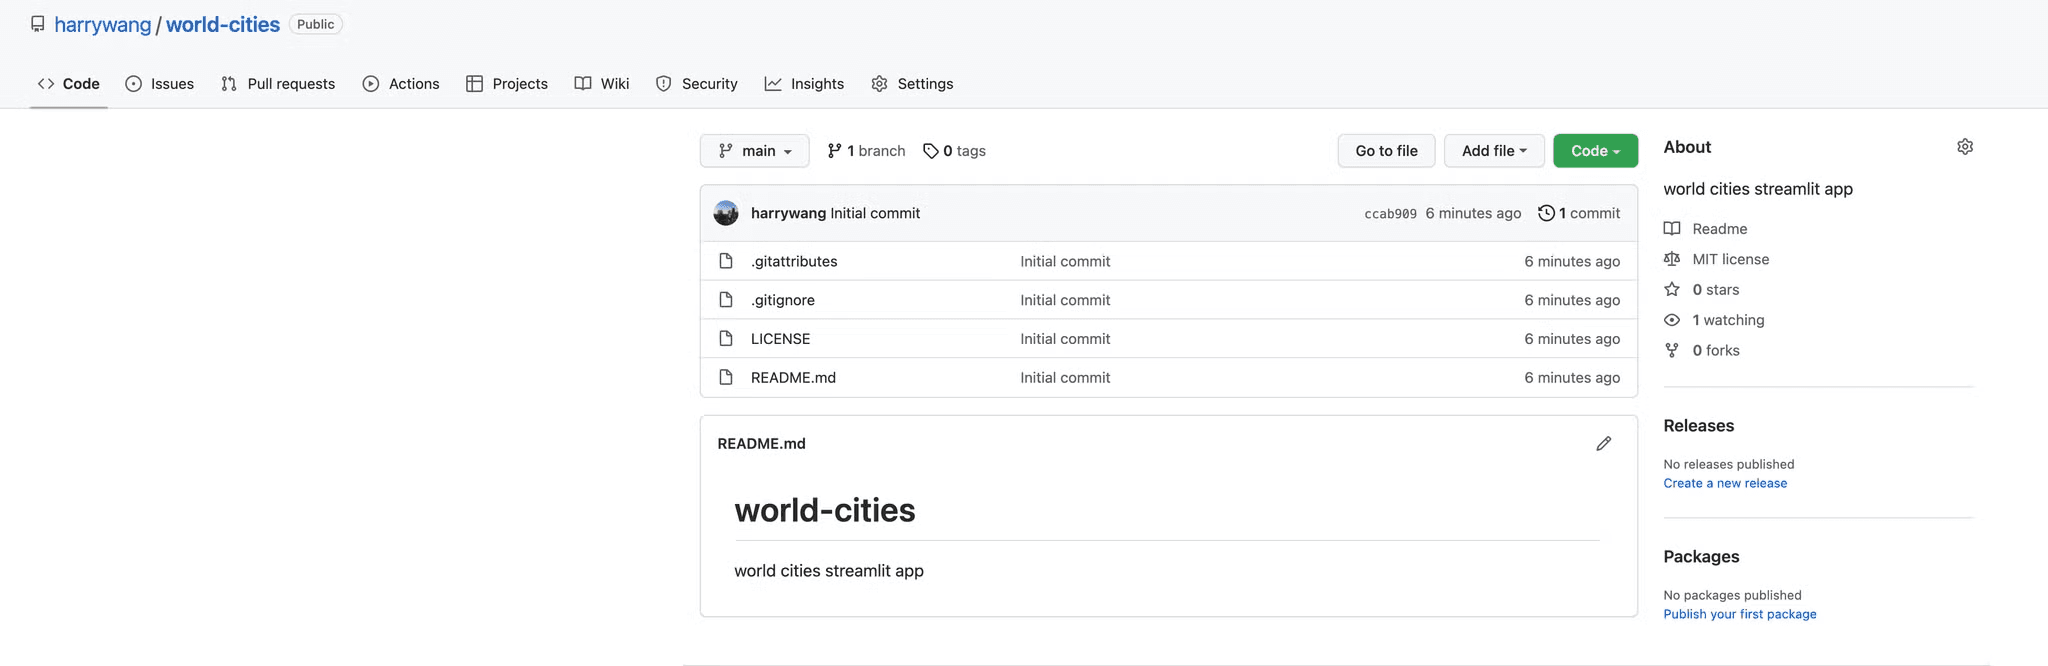
Then, go to Github, you should see your repo, which is pretty much empty:
Copy the app-cities.py and worldcities.csv to the newly created wrold-cities folder, add another requirements.txt file with three lines (this file is used by streamlit server to install required packages for your app):
matplotlib
pandas
streamlit
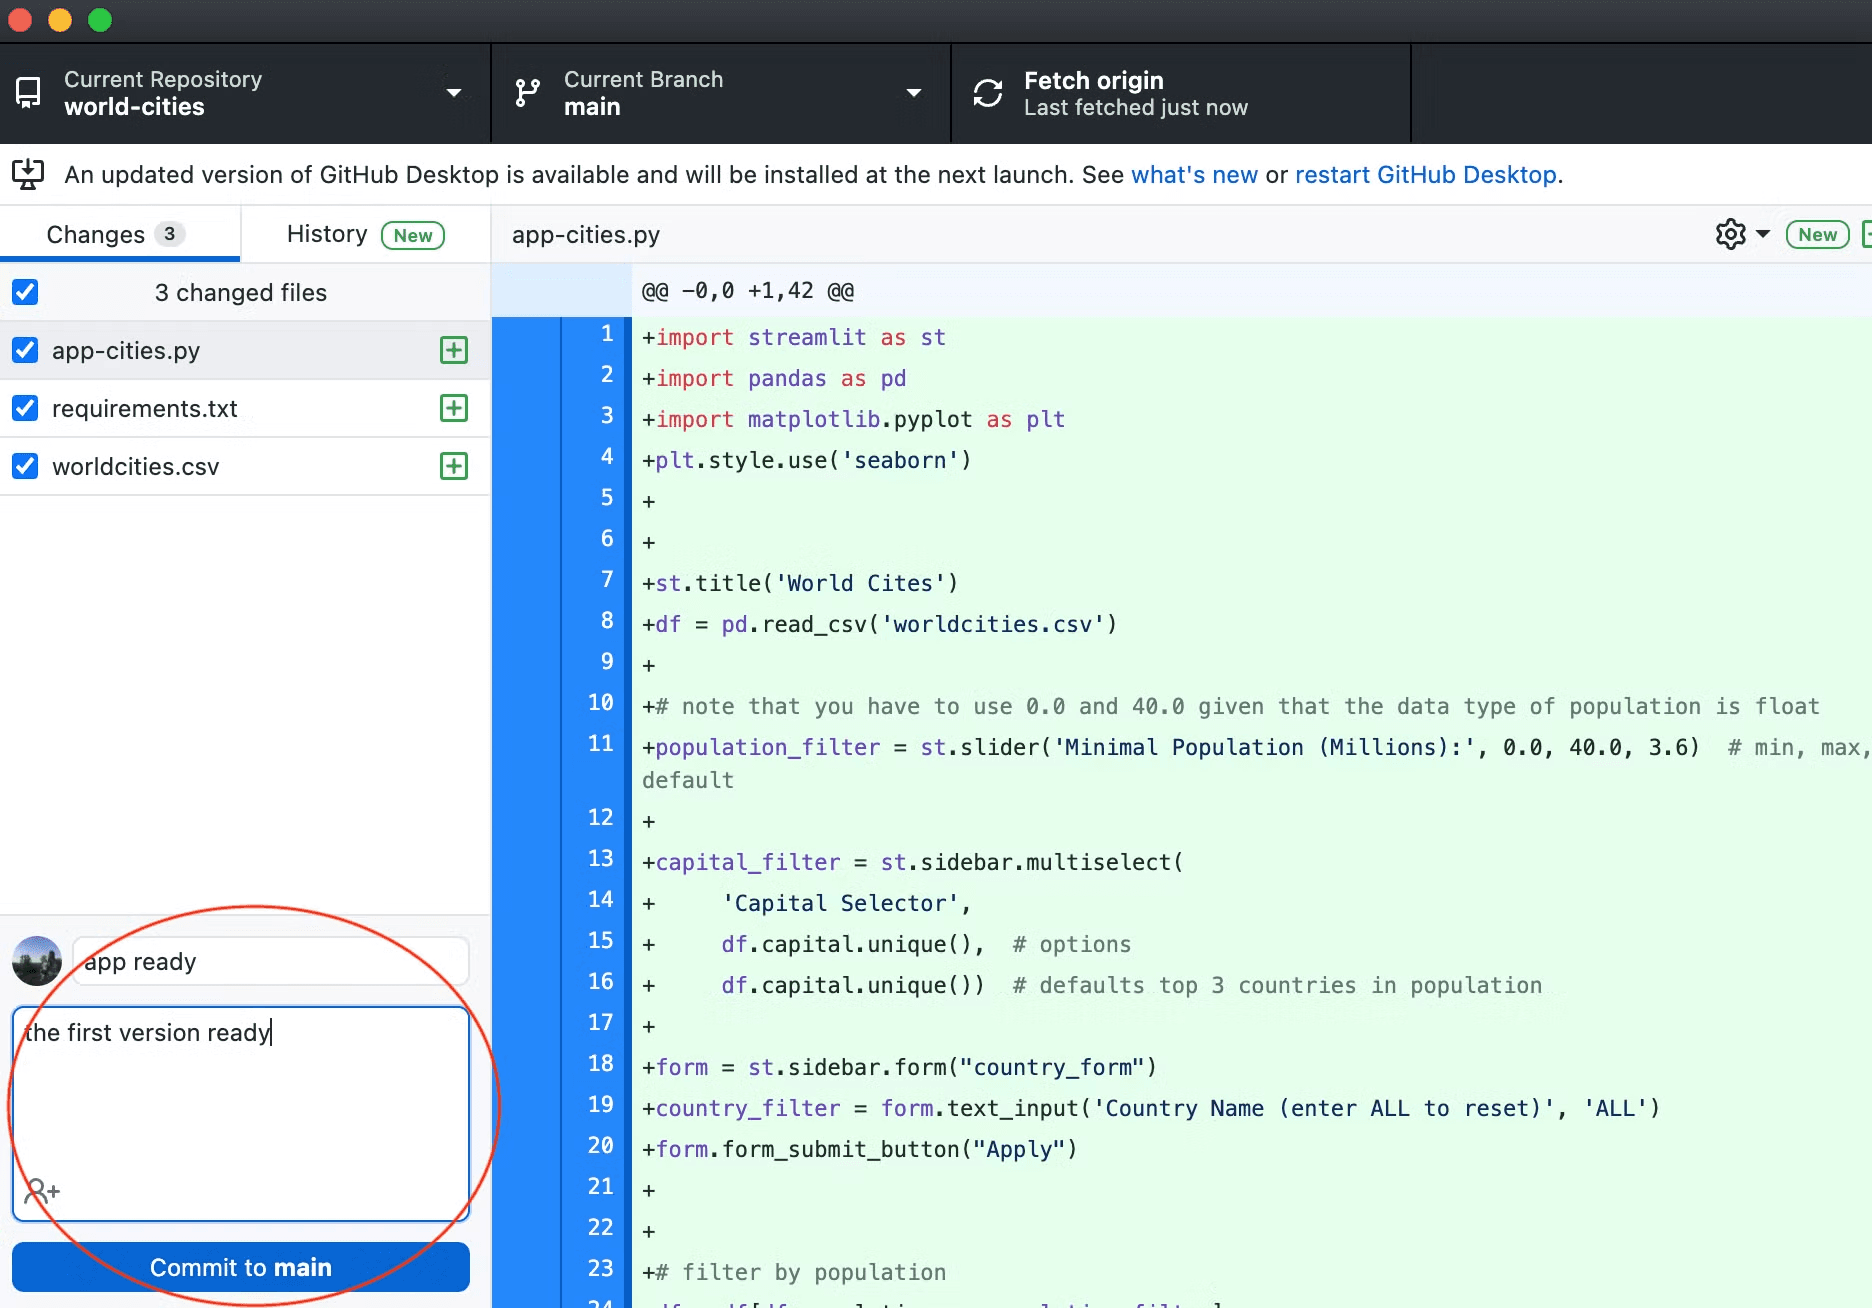
Go back to Github Desktop and you should see the new files, commit the changes and push the changes to Github:
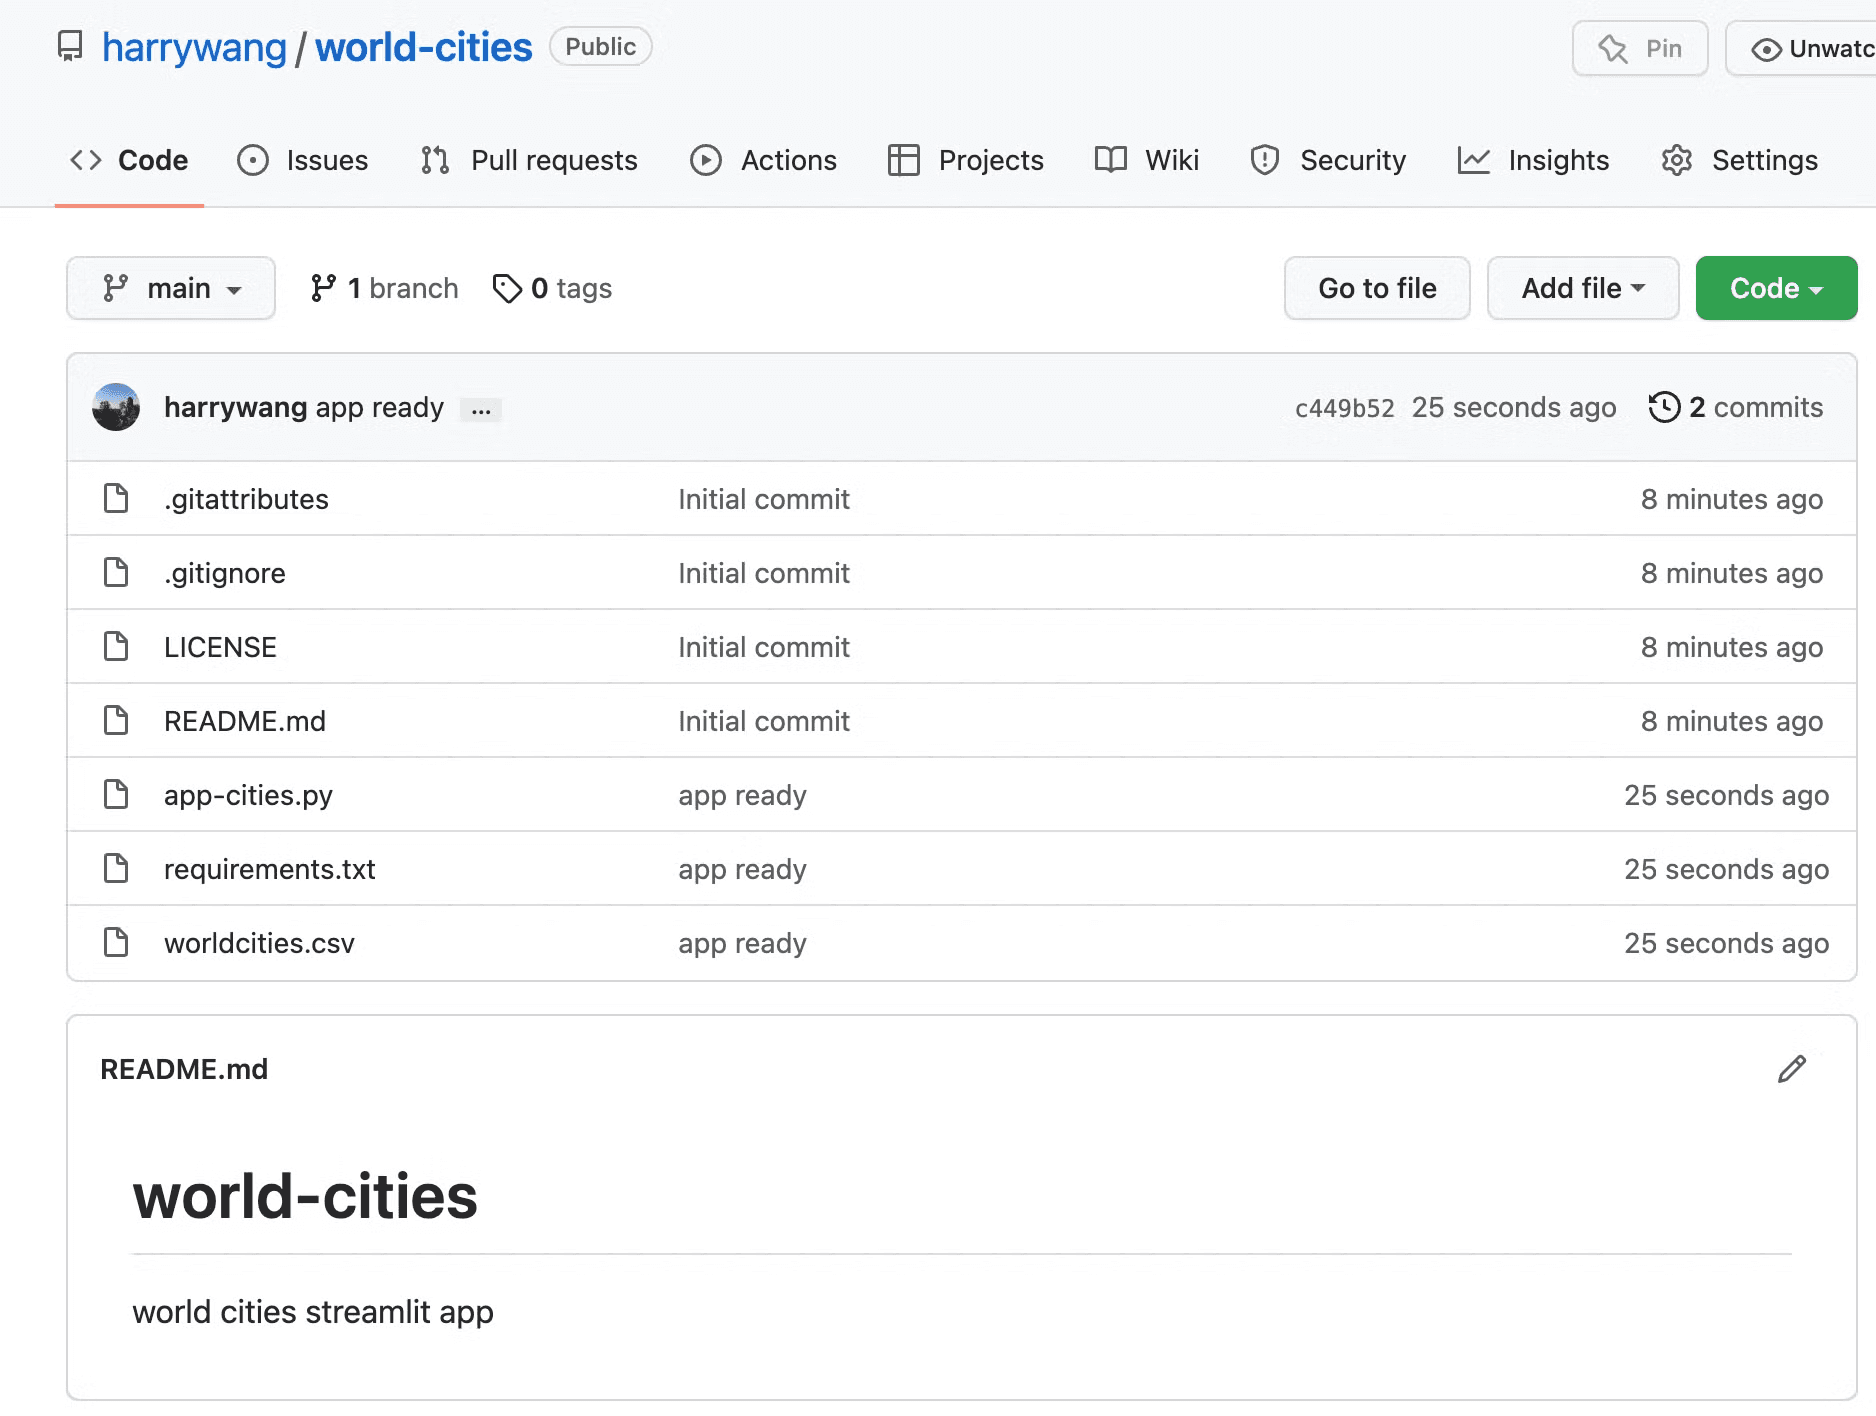
Now, you should see all files on Github:
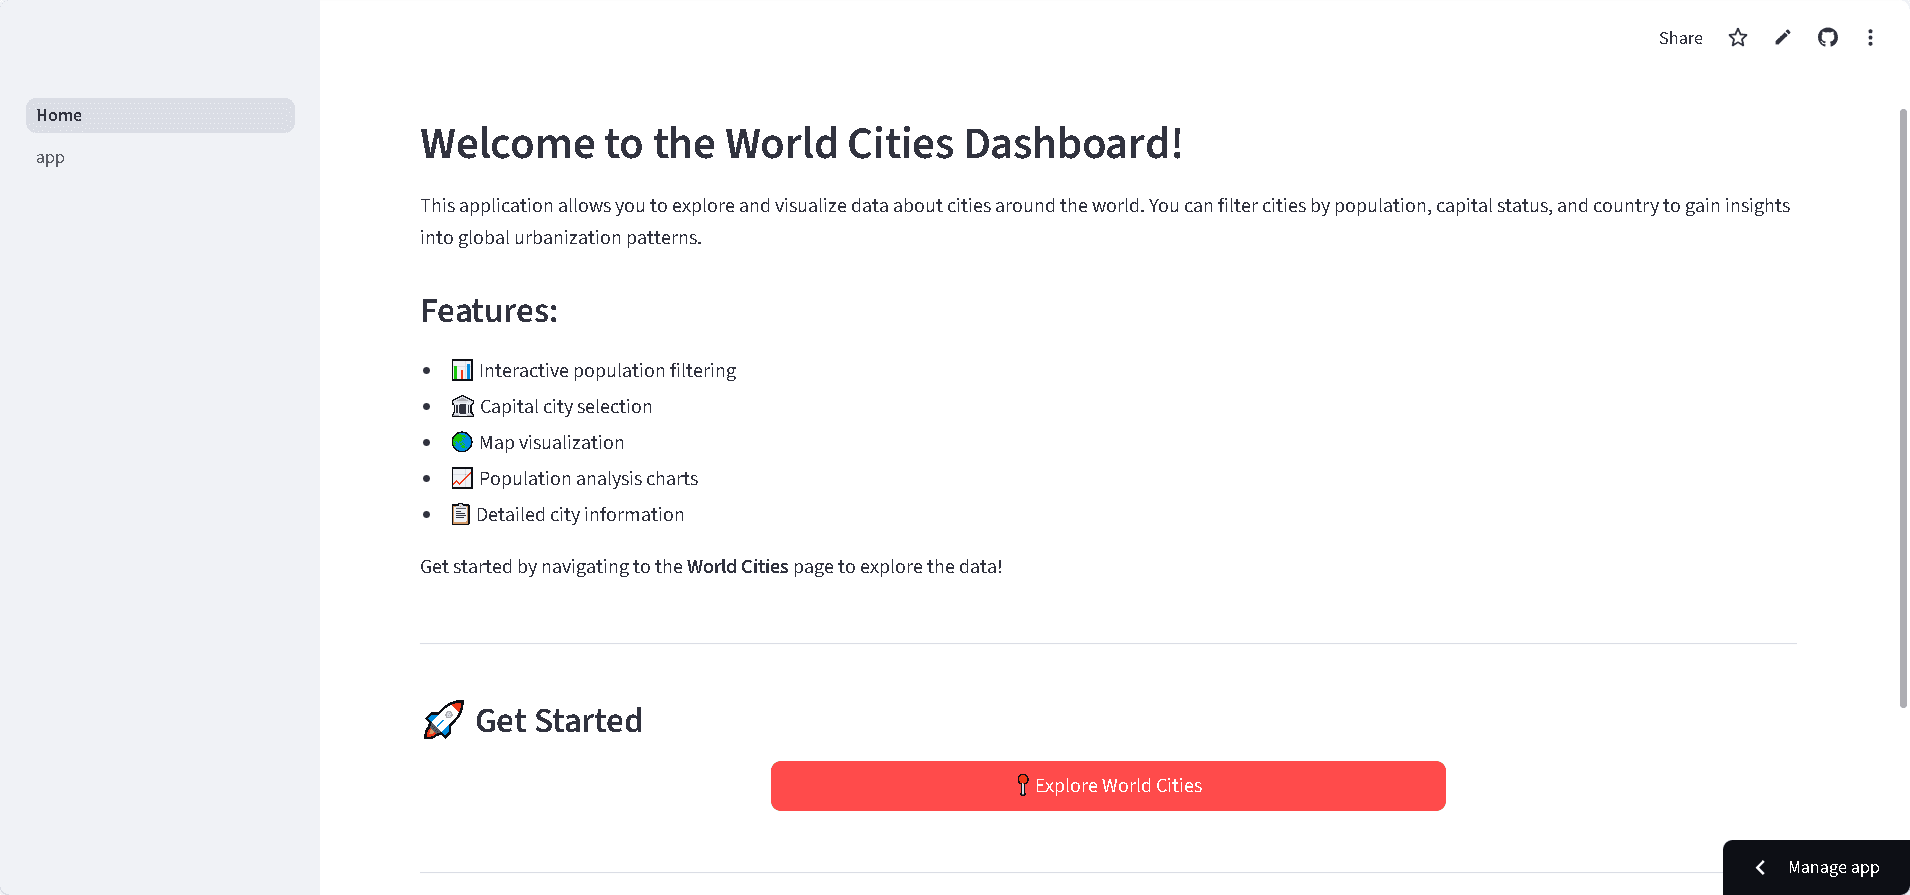
Follow the prompt below, we want to use Copilot to help us create a home page:
Create a Streamlit multipage app project structure with the following:
- A Home.py file that serves as the main entry point, displaying a title, welcome text, and a button to go to app.py.
- A "pages" folder where app.py will be located.
Only generate the Home.py content; I will add app.py later.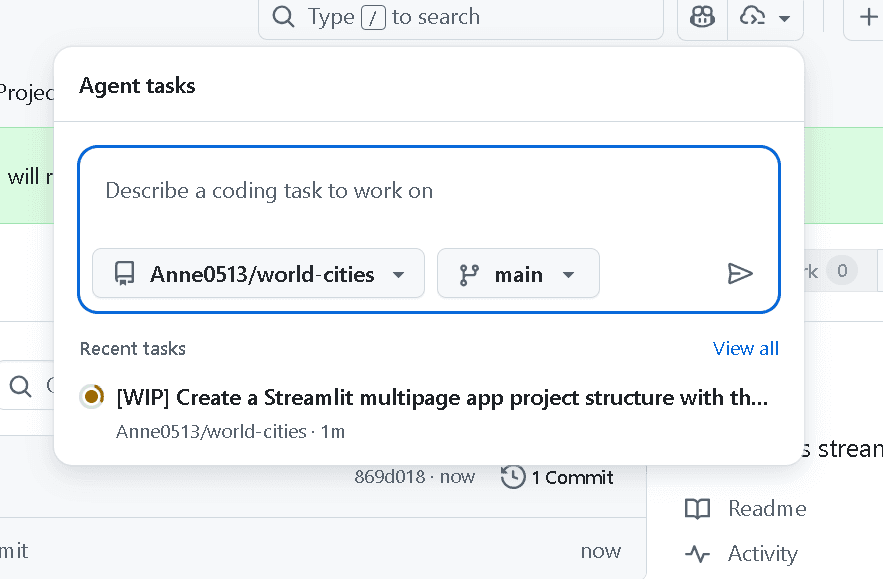
We click the cell below, and wait until Copilot end the process:
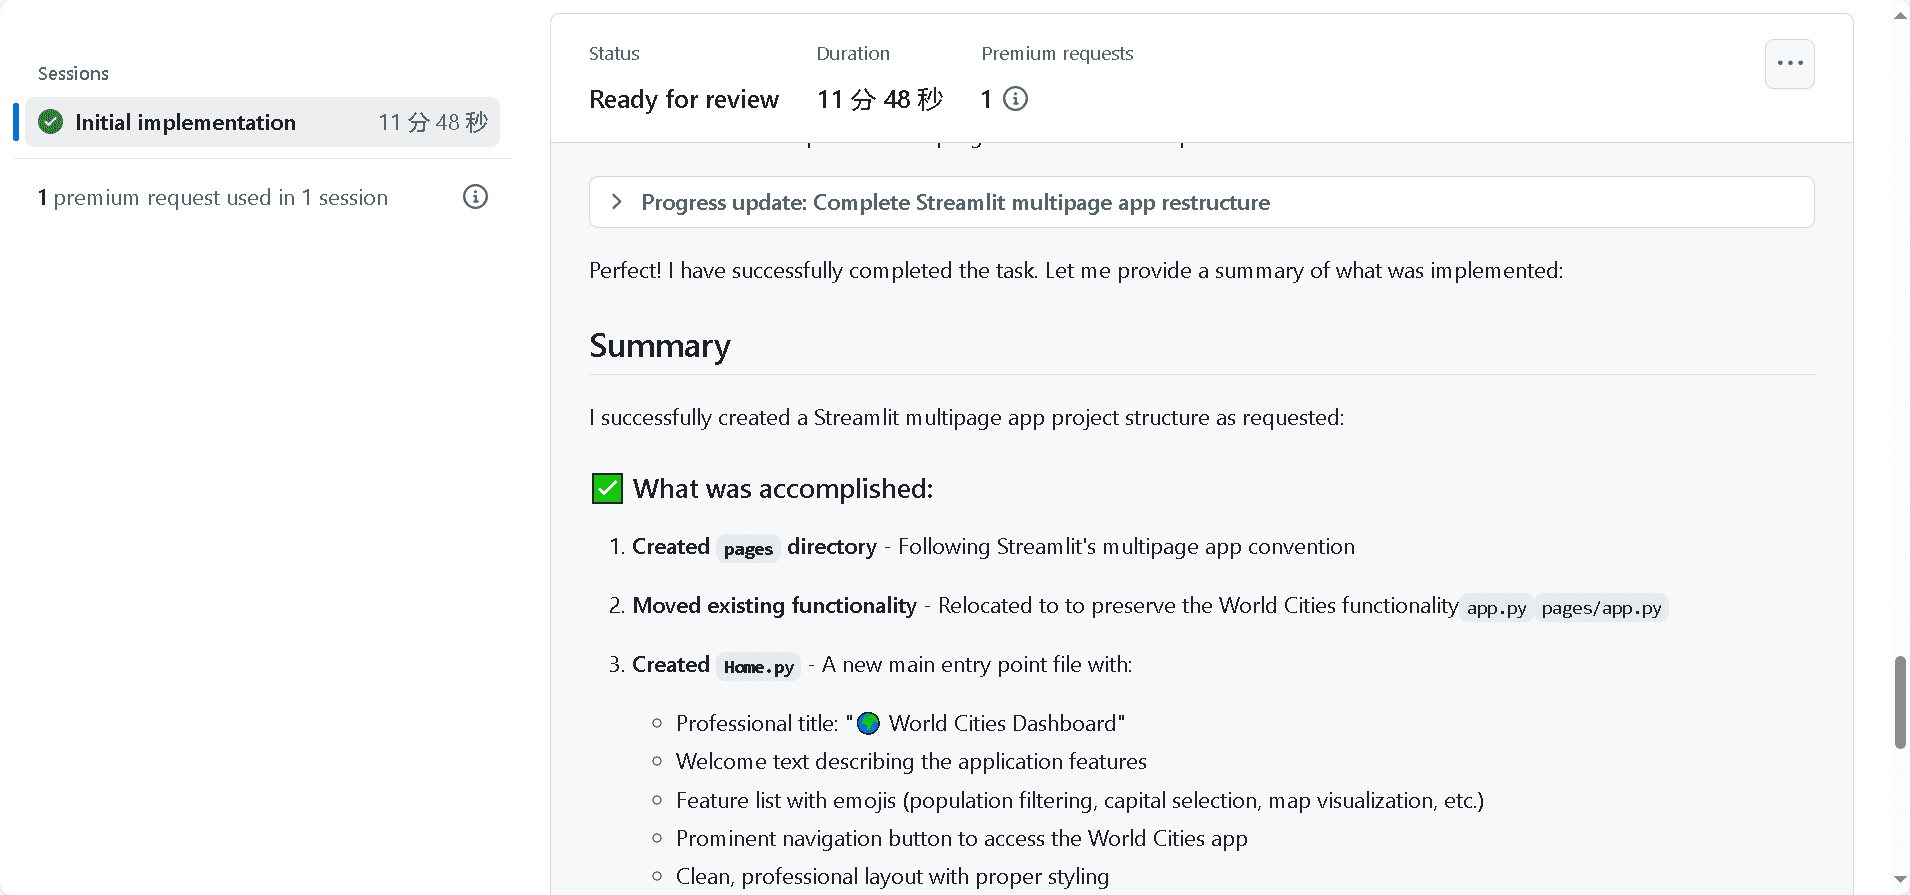
Login to https://streamlit.io/ and create a new app:
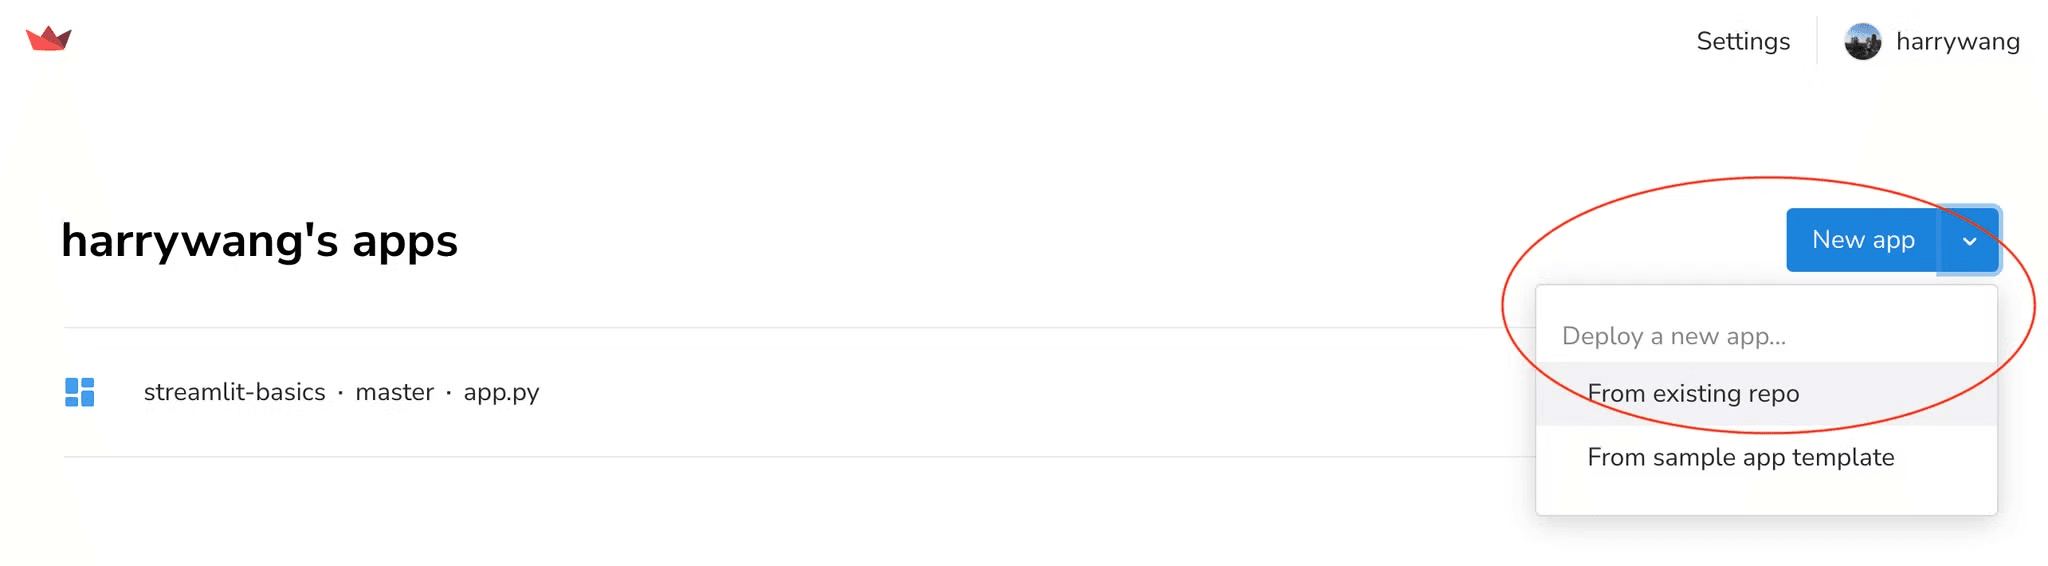
Choose the new repo we just published and click Deploy - that’s it!
You can use Paste GitHub URL option by entering the streamlit app file path, such as https://github.com/harrywang/world-cities/blob/main/app-cities.py
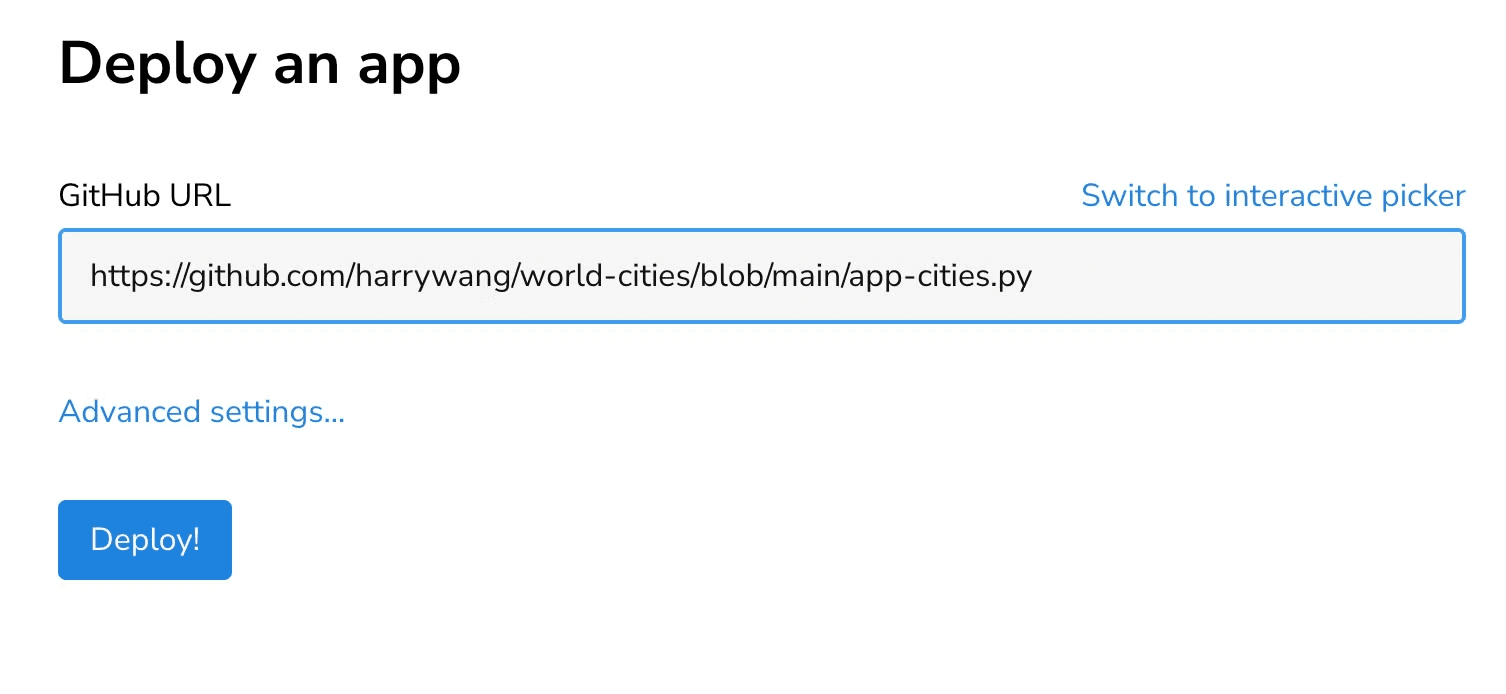
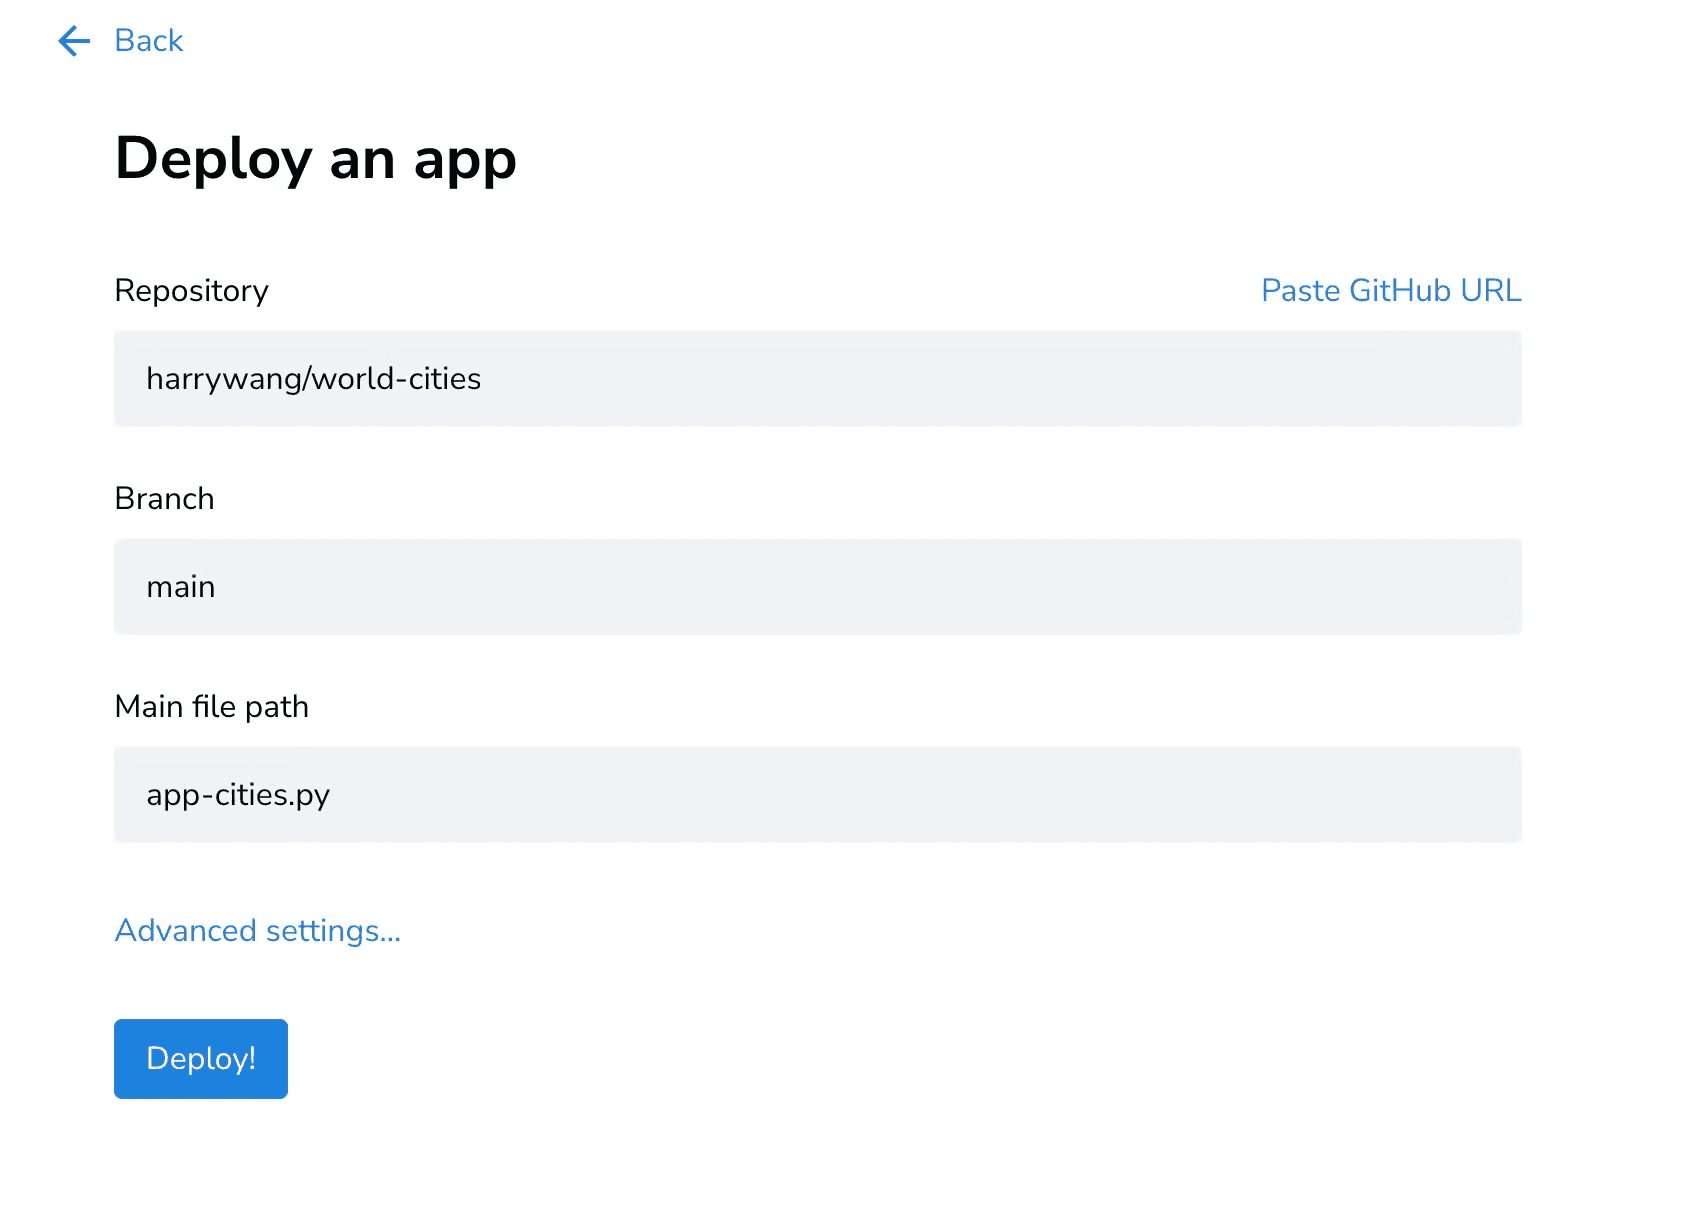
Or you can specify the app file directly:
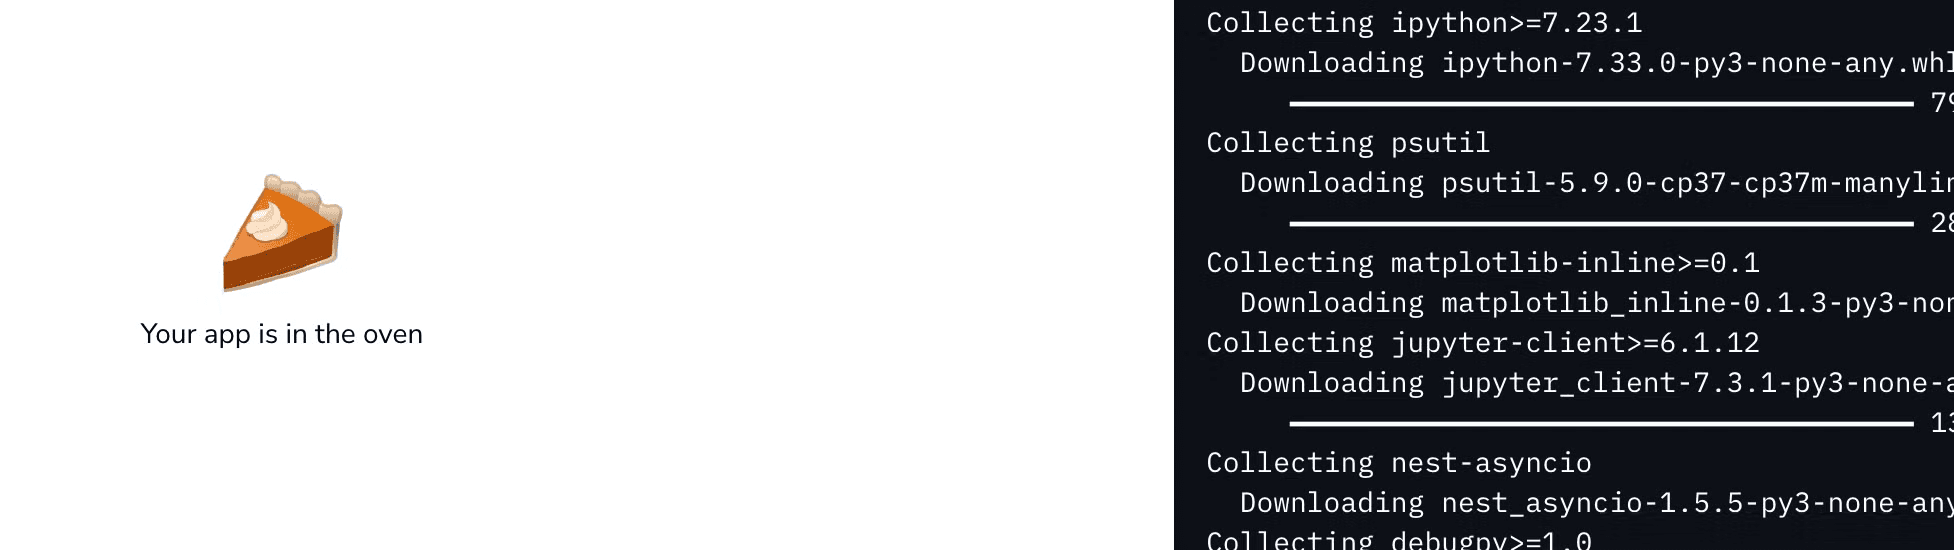
Wait for the process to finish and you should see your app deployed.
You can share the app with anyone in the world:
Assignments
Titanic App with Data Analysis and Prediction
Using the Titanic dataset (train.csv) and a pre-trained model file (titanic_model.pkl), complete the following tasks with Streamlit, matplotlib, and the Copilot agent.
Tasks
- Home Page (
home.py)- Use the GitHub Copilot agent to generate a simple Streamlit page called Home.
- The page should display a welcome message and include a button that navigates to the main Titanic app (
app.py). - Screenshot 1: Home page.
- App Analysis Page (
app.py)- Import the necessary libraries and apply the seaborn style.
- Display the page title: “Titanic App by [Your Name]”.
- Read the
train.csvfile and display the entire dataframe in the Streamlit app. - Create three side-by-side box plots (figure size 15×5):
- Show the ticket fare (
Fare) distribution for each passenger class (Pclass = 1, 2, 3). - Each subplot must have appropriate x-axis and y-axis labels.
- Show the ticket fare (
- Display the plotted figure in the Streamlit page.
- Screenshot 2: App Analysis page.
- App Prediction Page (
app.py)- Add a new page/tab for prediction.
- Load the trained model from
titanic_model.pkl. - Provide input widgets for:
- Passenger Class (1, 2, 3)
- Sex (male/female)
- Age
- Fare
- Encode inputs consistently with model training (e.g., Sex: male=1, female=0).
- Use the model’s
predict_probamethod to calculate the survival probability. - Display the predicted probability in a user-friendly format.
- Test Case: Run the prediction with input values →
Pclass = 2,Sex = male,Age = 24,Fare = 32. - Screenshot 3: App Prediction page showing the result for this test case.
Deliverables
- Upload exactly three screenshots:
- Home page
- App Analysis page
- App Prediction page (with test case result)