
Data App Lab
Part I
In this assignment, you need to use the housing dataset to develop a data app using Streamlit:
-
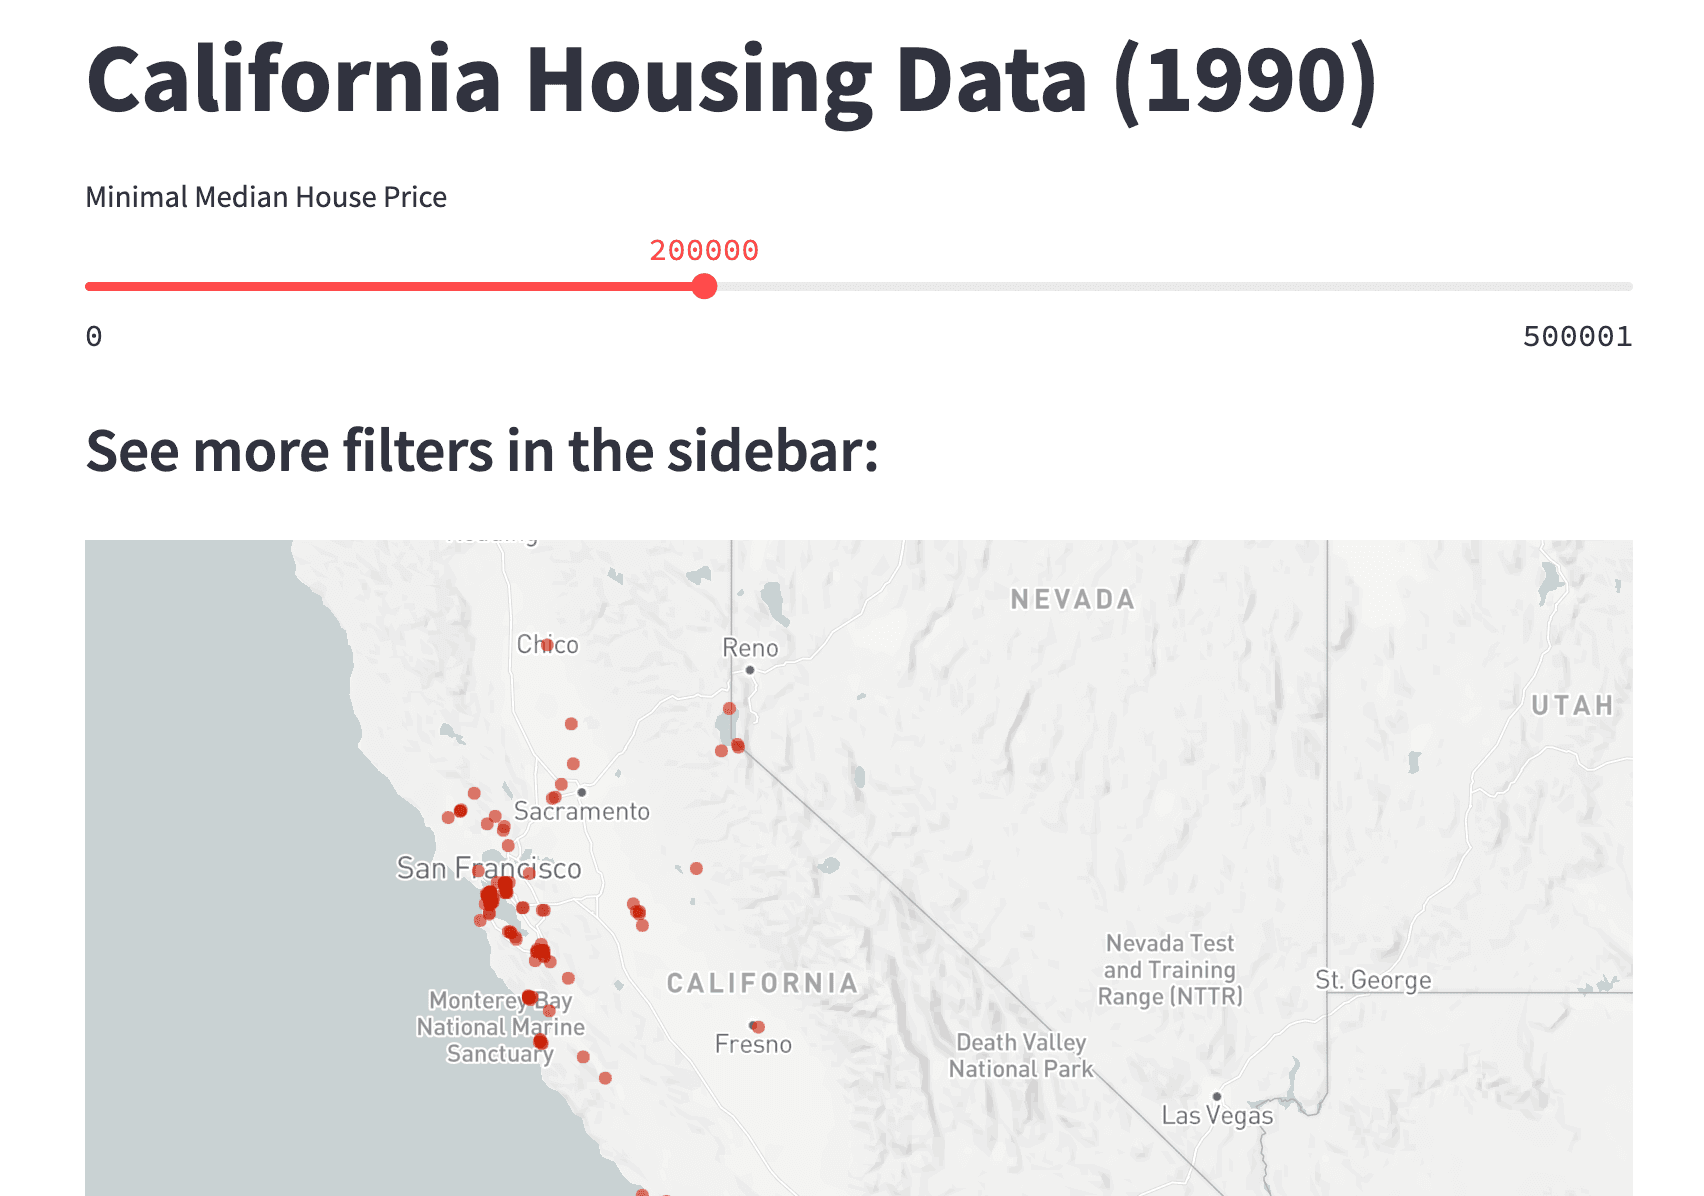
you need to have a price slider as follows
-
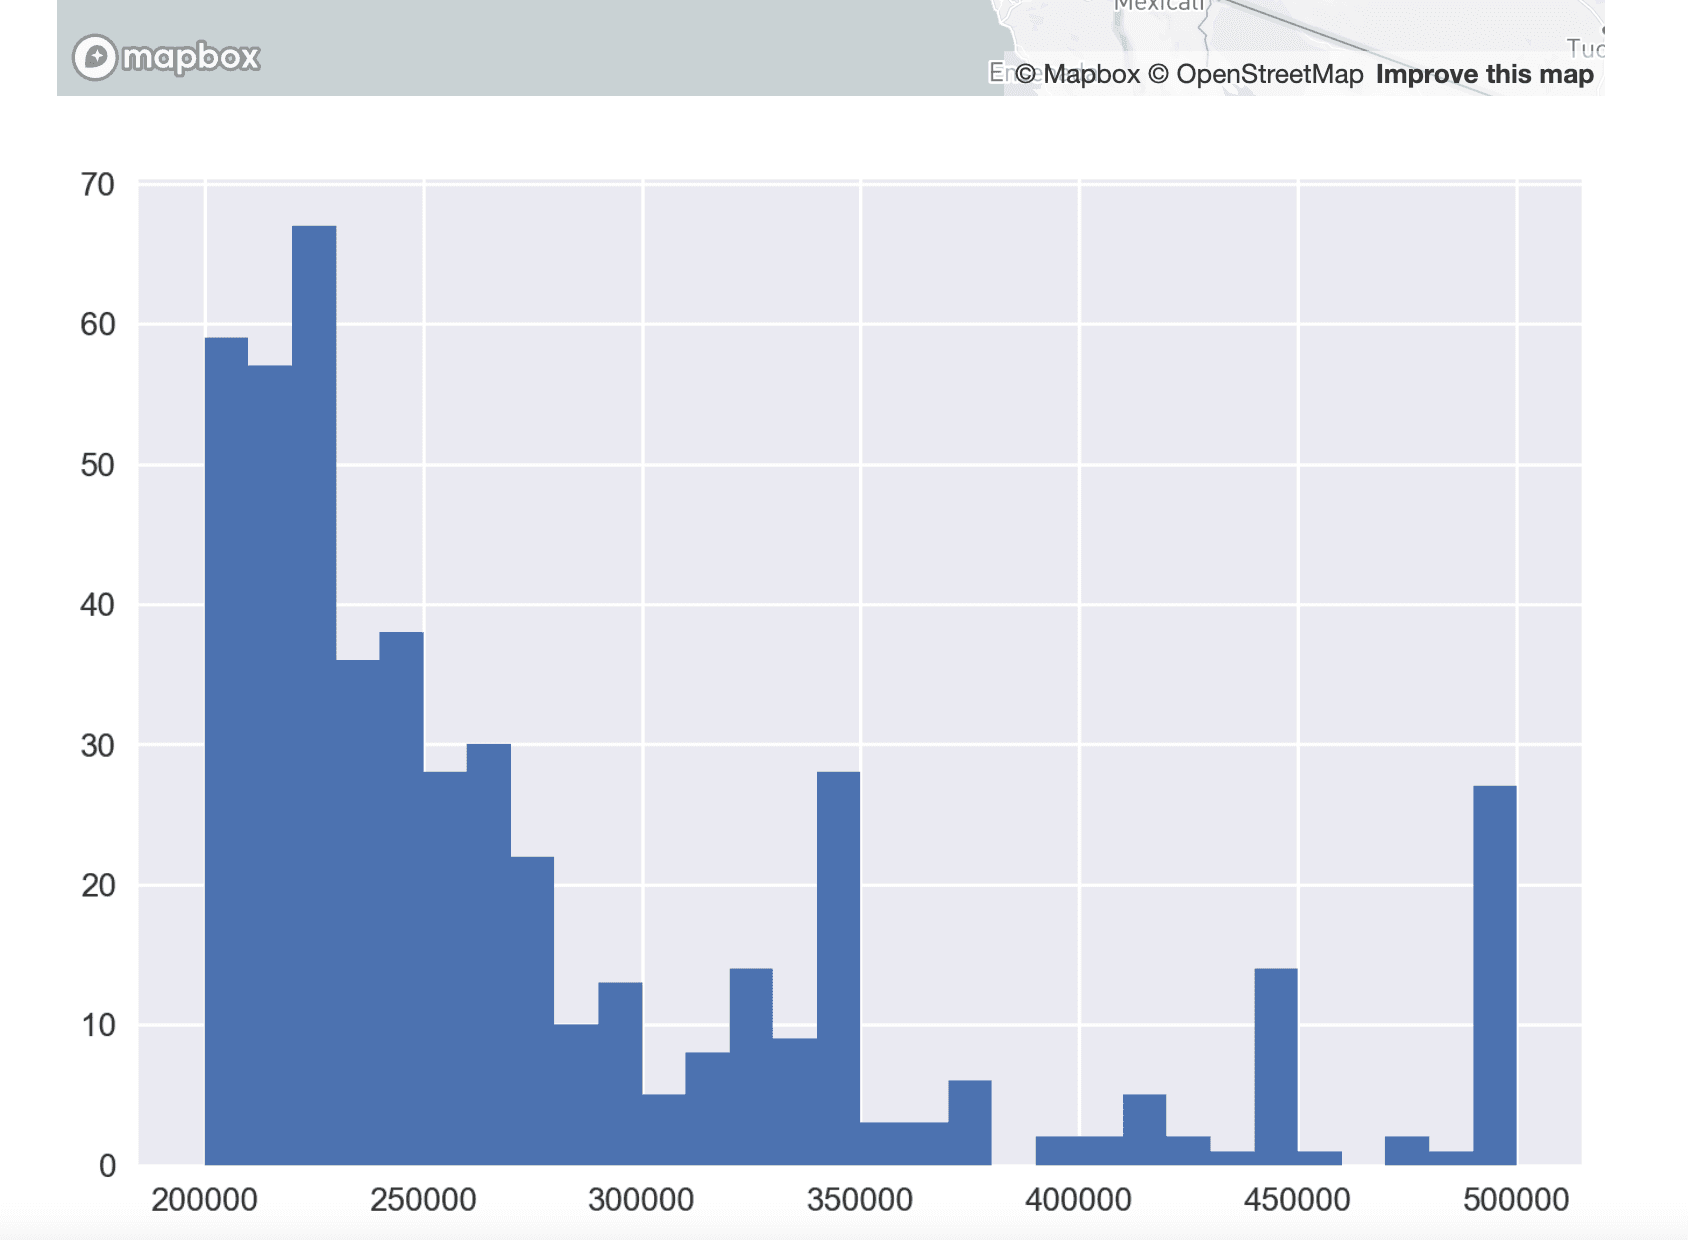
you need to show the data on map and a histogram of the median house value below the map (the number of bins should be 30)
-
you need to have a sidebar as shown below
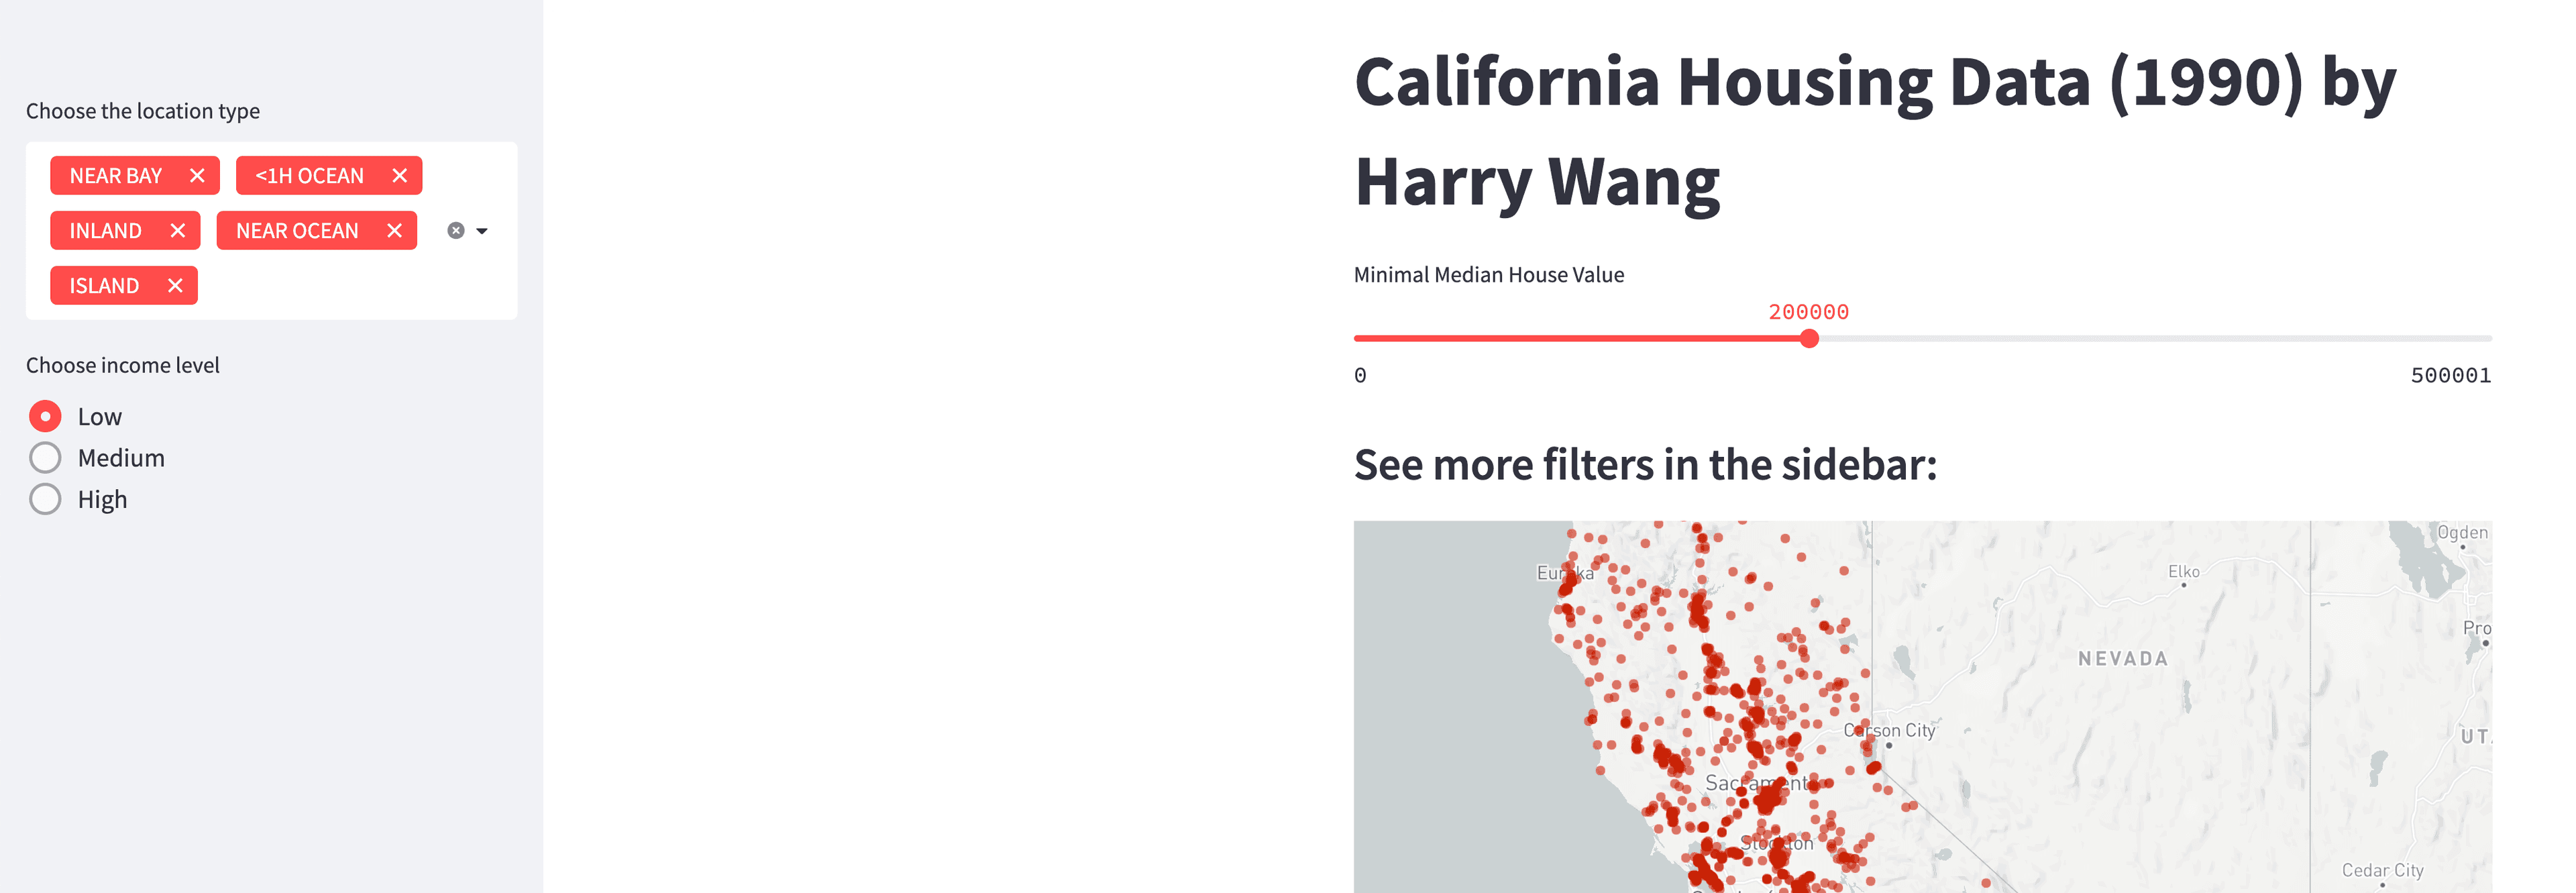
- a multiselect widget to filter the location type
- a radio button widget to filter by income level, Low (≤2.5), Medium (> 2.5 & < 4.5), High (> 4.5), you need to use an if statement to filter the dataframe based on radio button selection, refer to the example at https://docs.streamlit.io/library/api-reference/widgets/st.radio
Part II
You need to follow what I teach in the lecture to deploy the app to Streamlit cloud.
Submission
-
you need to submit the Streamlit app python file to canvas for grading
-
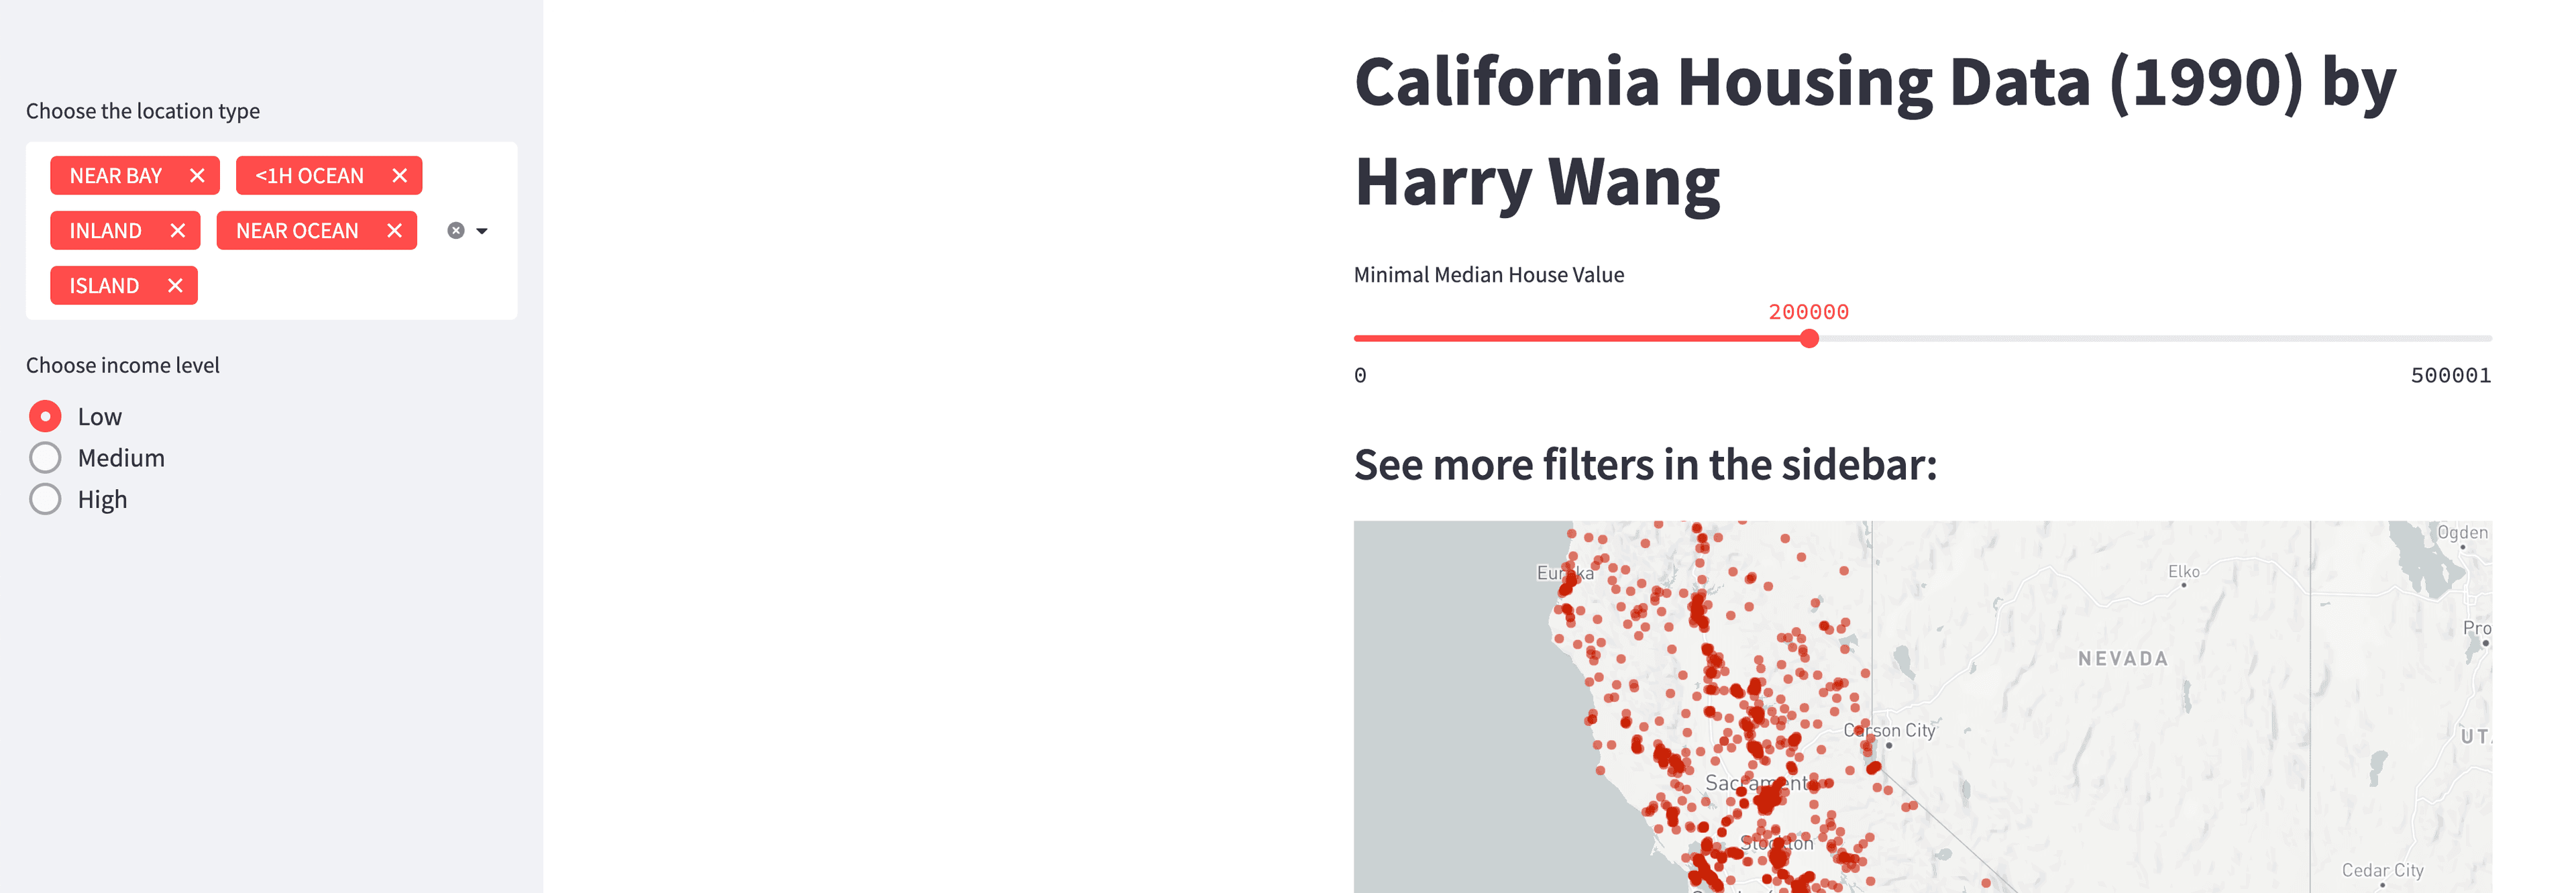
you need to make a screenshot of your app and upload the image to canvas for grading, such as the one below but showing your name:
-
you need to submit the url of your app on Streamlit cloud and make sure it works