Rule-Based Prediction
Based on the EDA, we could develop simple rule-based predictions, which can serve as the baseline for the comparison with predictions based on machine learning models.
Let’s use the Titanic dataset as an example:
df_train = pd.read_csv('train.csv')
df_train.Survived.value_counts(normalize=True)

0    0.616162
1    0.383838
Given the overall survival rate, we can have the following rule-based baseline:
Baseline 1: predict all passengers are dead (survived = 0) because survival rate is only 38.4%
df_train.groupby('Sex').Survived.value_counts().to_frame()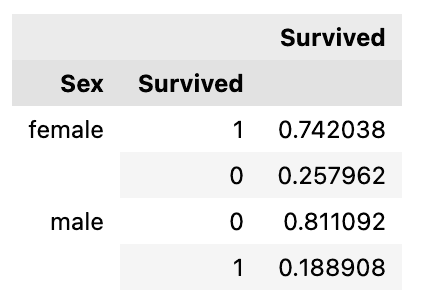
Based on the survival rates by gender, we can have another rule-based baseline:
Baseline 2: predict the all male passengers are dead and all female passengers survived, given female survival rate is 74.2% and male survival rate: 18.9%
Next, we will make predictions based on the two baselines and submit to Kaggle for scoring - we will learn how those scores are calculated in the following lectures on Model Evaluation.
Normally, Kaggle competition provides at least three files:
- the training data (the target is included)
- the testing data (you need to predict the target)
- sample submission file (show you the format of your submission file)
Go to Titanic site (https://www.kaggle.com/c/titanic) and download the three files.
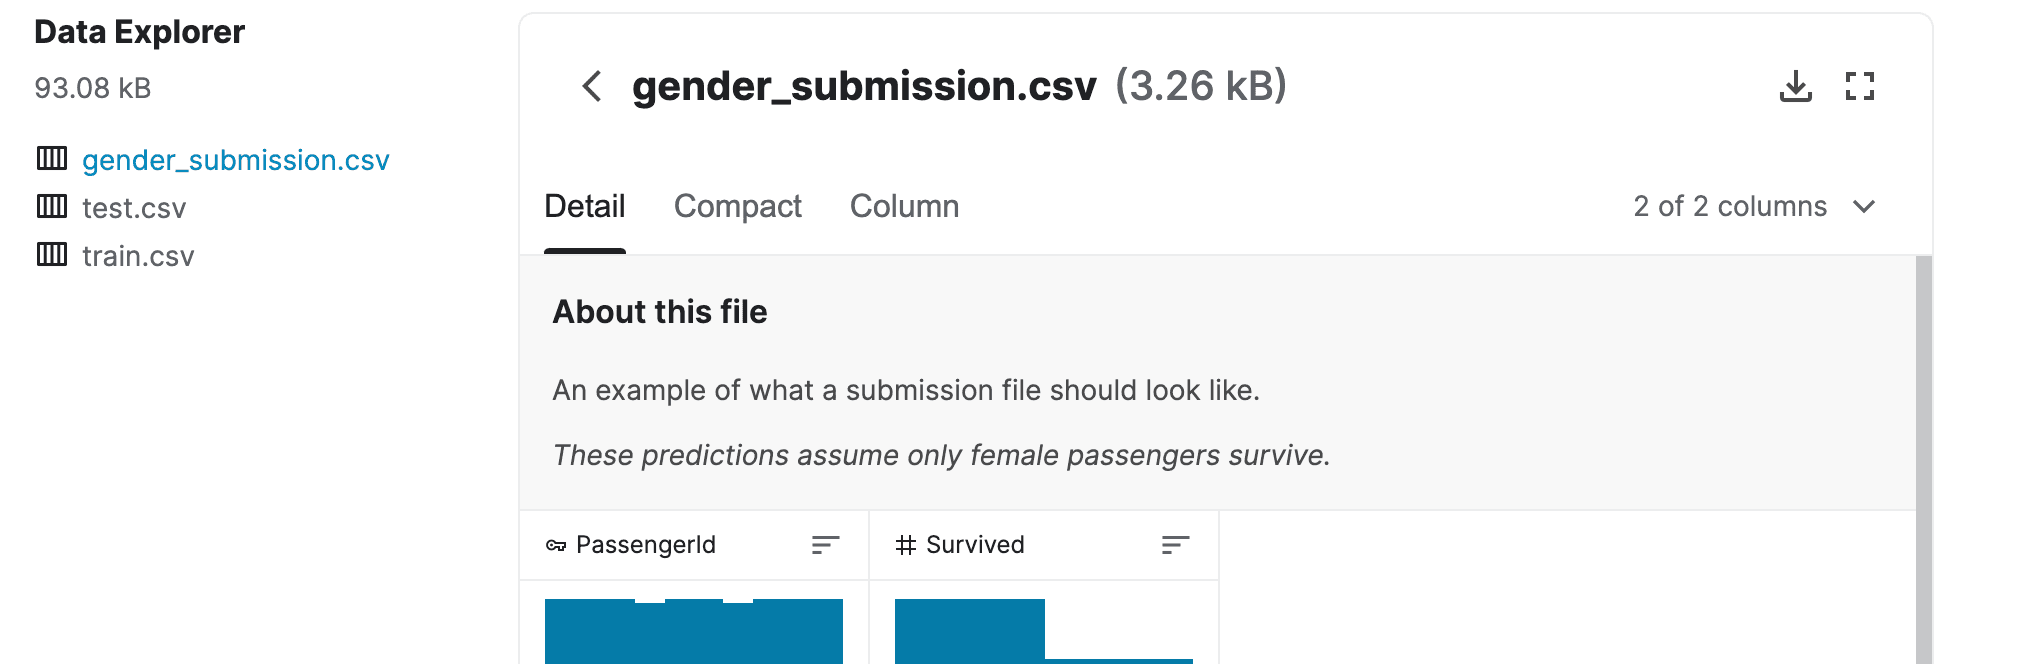
From the sample submission file, we know only two columns are needed with names: PassengerId and Survived where PassengerId must match the PassengerId in test.csv file.
Create the submission file for Baseline 1:
# predict all passengers are dead (survived = 0) because survival rate is only 38.4%
df_test['Survived'] = 0  # create a new column
df_submit_baseline_1 = df_test[['PassengerId', 'Survived']]  # only two columns are needed

# save the dataframe to a csv file for submission
# index=False we don't need index to be in the csv file
df_submit_baseline_1.to_csv('submit_baseline_1.csv', index=False)
Submit the generated CSV file to Kaggle for scoring:
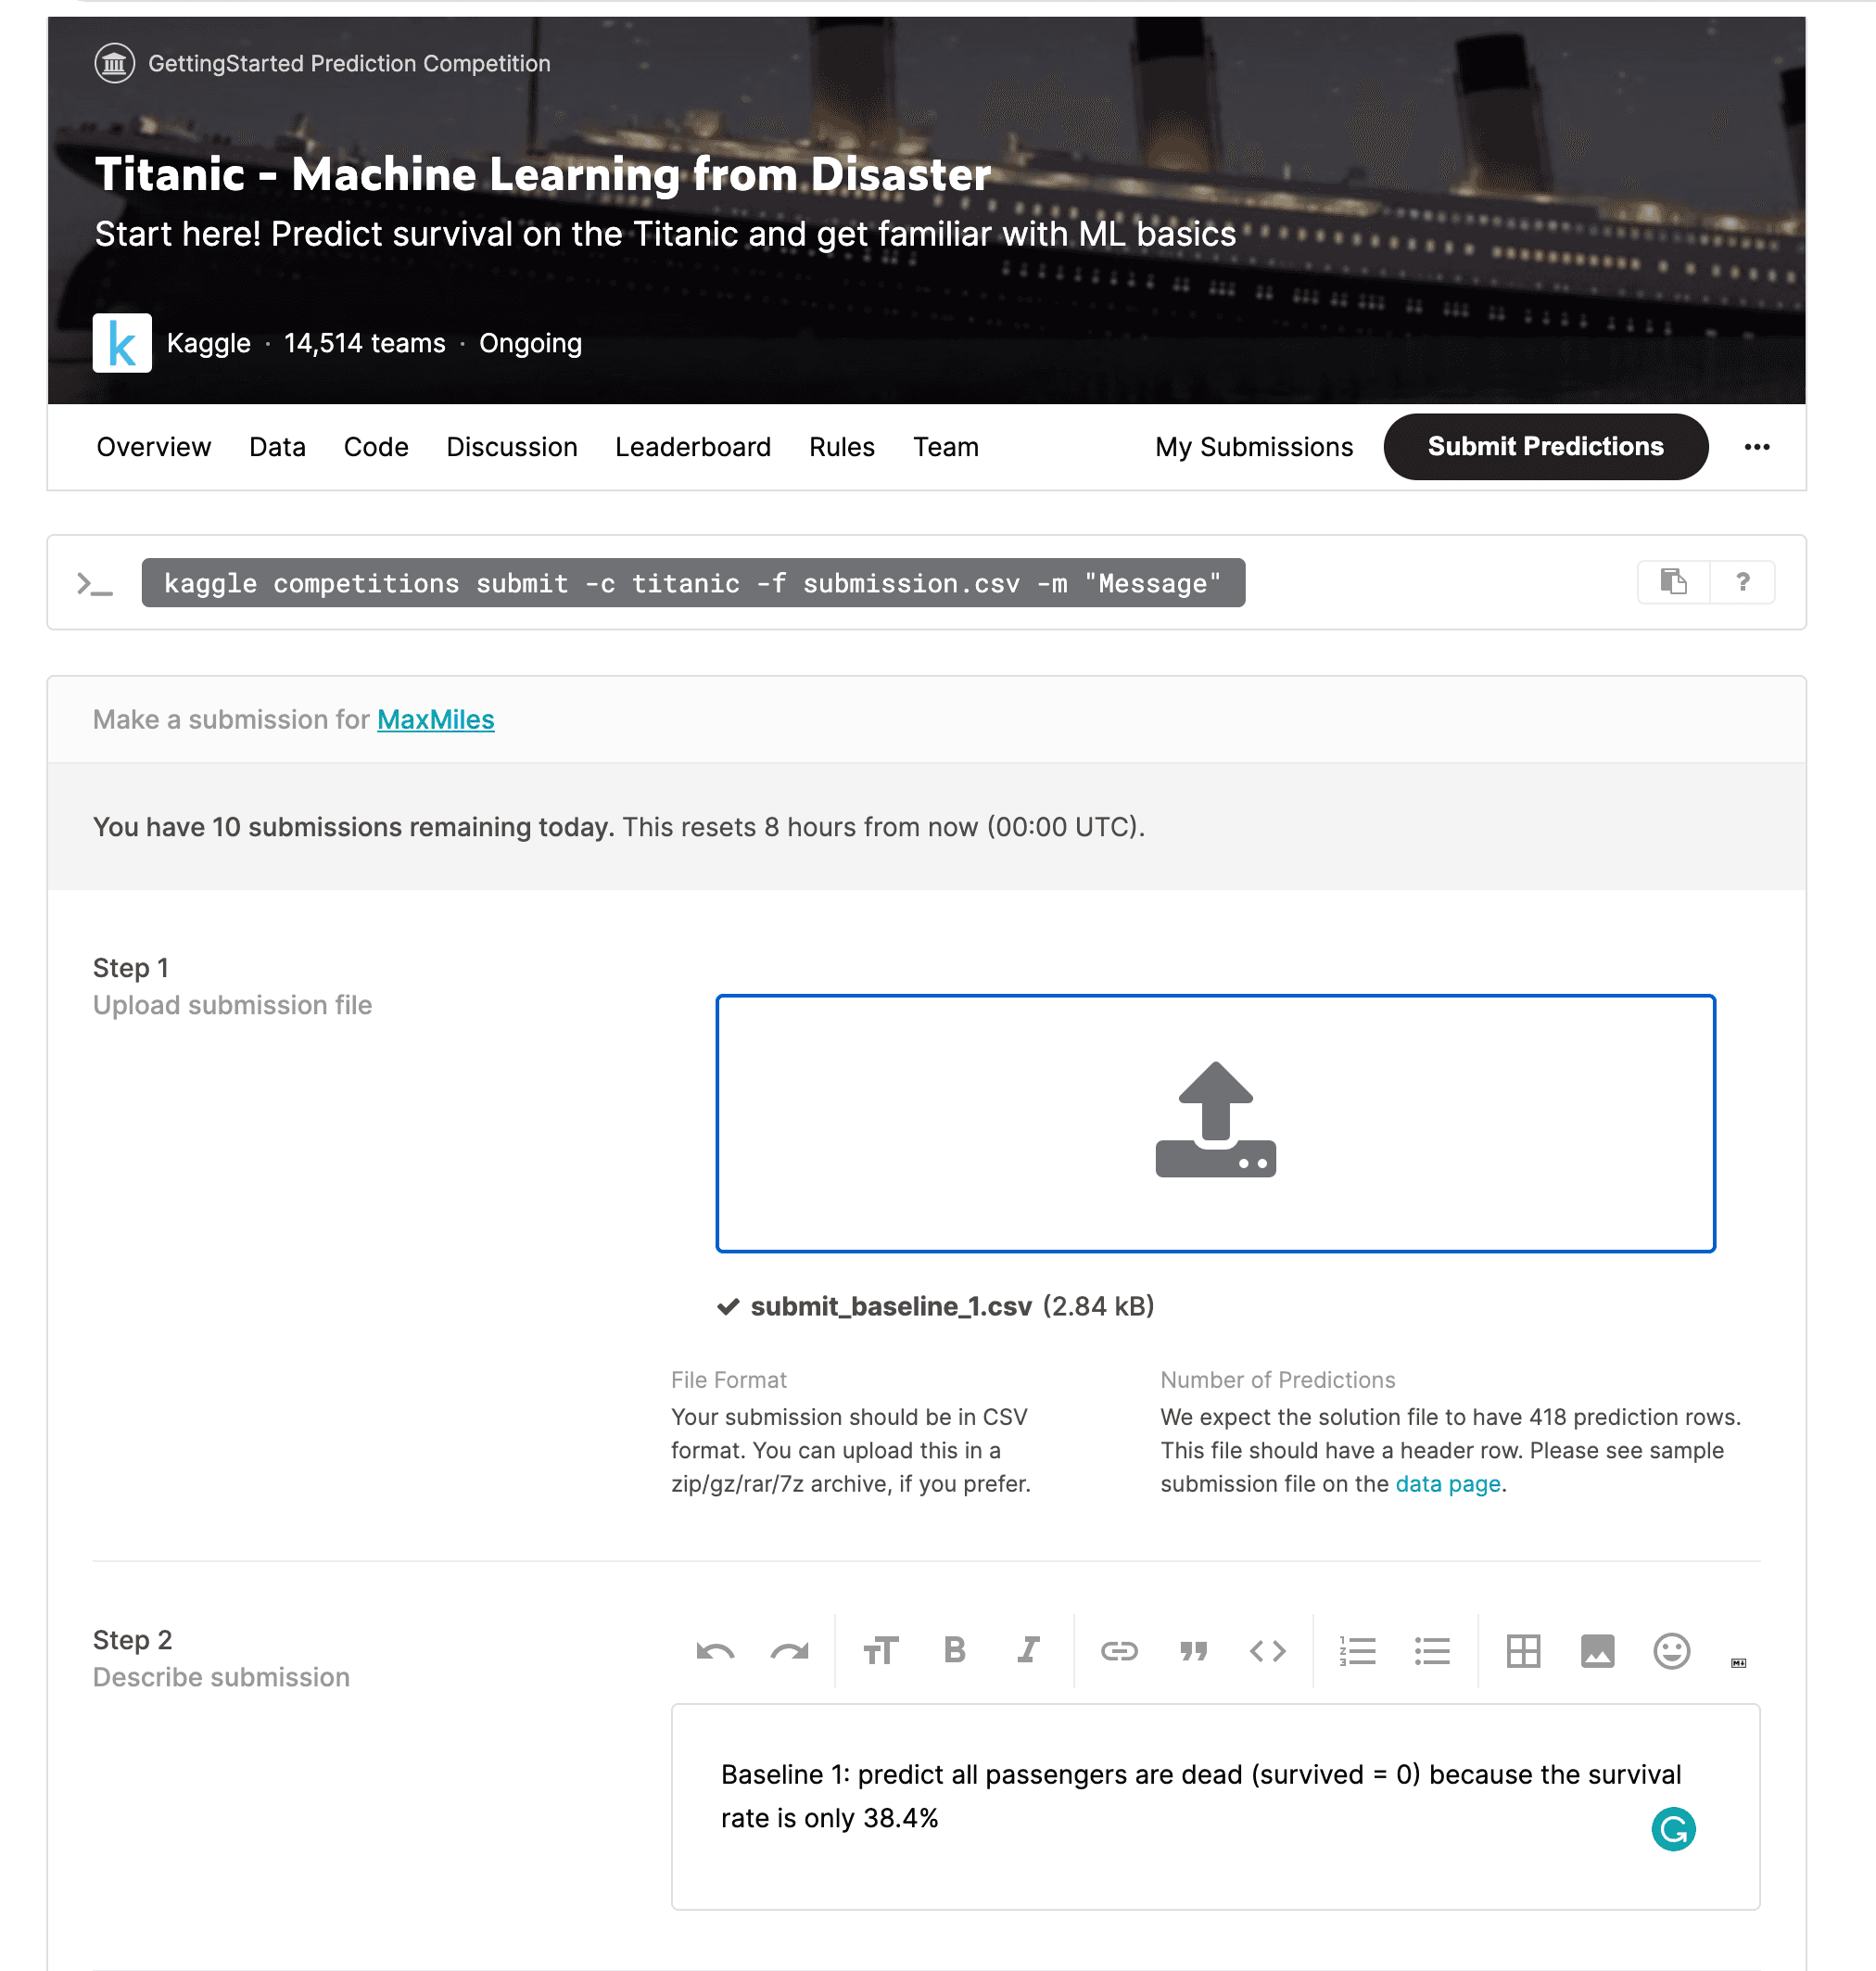
Baseline 1 score is 0.622 (as we will learn later, this is accuracy - the higher the better)
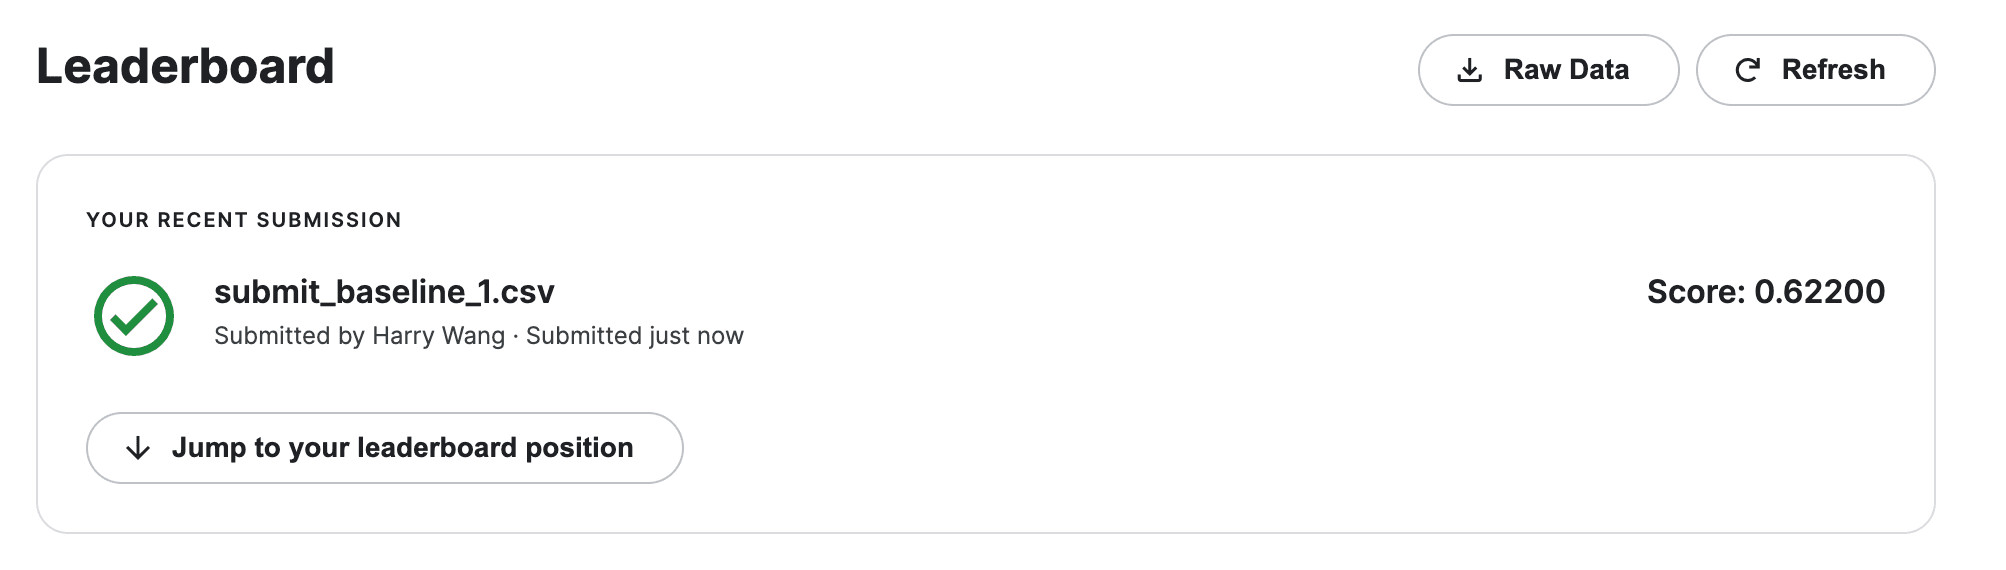
Now, let’s work on baseline 2: I show two ways to generate the target column (both are useful to learn):
- use
.loc[]and.astype()
# baseline 2: predict survived = 0 (dead) for male and survived = 1 (survived) for female
# .loc create a new column and enter values based on the values of Sex
df_test.loc[df_test.Sex=='male', 'survived_baseline_2'] = 0
df_test.loc[df_test.Sex=='female', 'survived_baseline_2'] = 1

# .loc cast 0/1 to float 0.0/1.0, which needs to be converted back to integer
df_test.survived_baseline_2 = df_test.survived_baseline_2.astype(int)- use
.apply()
# another way of generating the baseline 2 using .apply()
# first define a transformation function
def survival_by_gender(gender):
    if gender == 'male':
        survival = 0
    else:
        survival = 1
    return survival

# apply the function to Sex column to create a new column
df_test['survived_baseline_2_apply'] = df_test.Sex.apply(survival_by_gender)
Then we generate the csv file:
df_submit_baseline_2 = df_test[['PassengerId', 'survived_baseline_2']]  # only two columns are needed

# save the dataframe to a csv file for submission
# header specifies the column names in the csv file
# index=False we don't need index to be in the csv file
df_submit_baseline_2.to_csv('submit_baseline_2.csv', header=['PassengerId', 'Survived'], index=False)
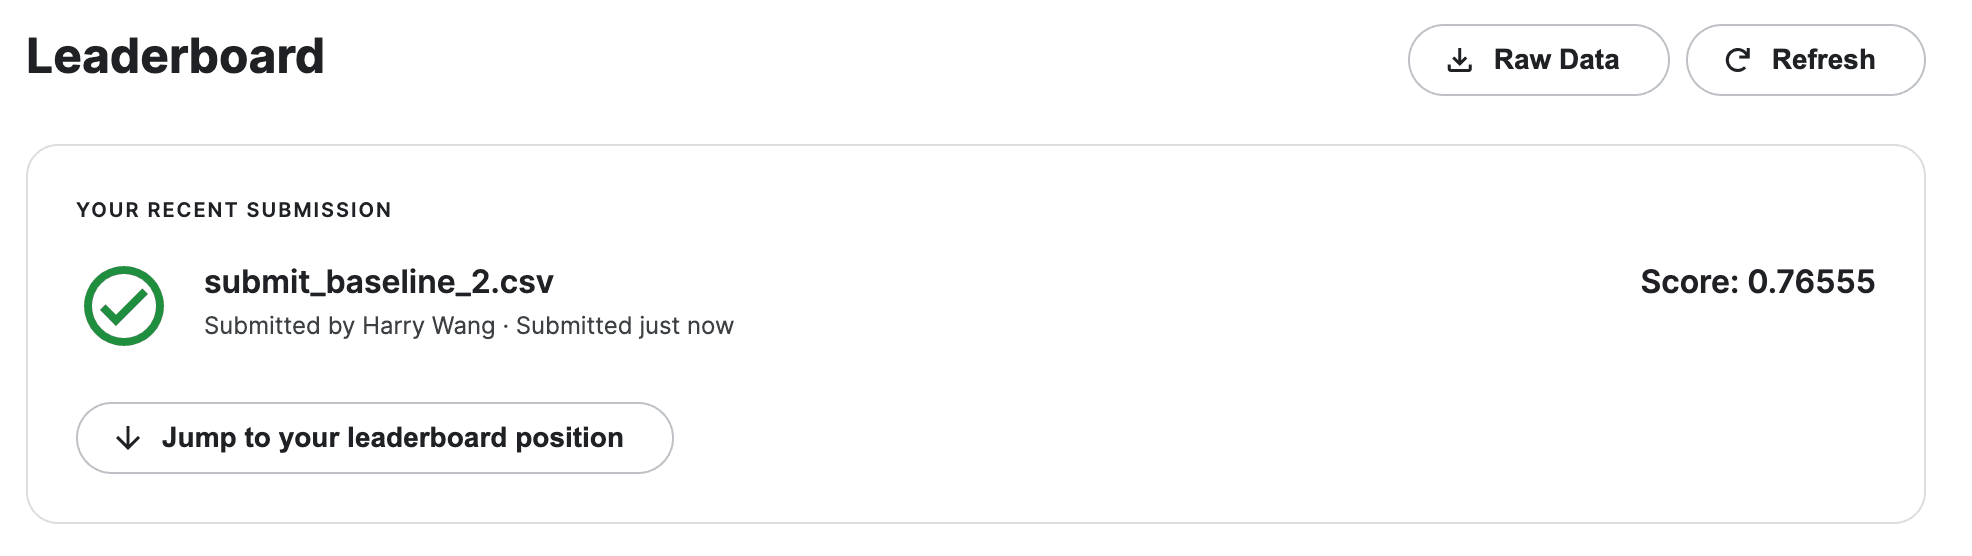
Submit to Kaggle for scoring. Baseline 2 gets 0.766, which beats Baseline 1.