
Assignment 1: Exploratory Data Analysis
Two parts, two very different jobs.
In Part 1 you are handed the questions and asked to answer them exactly. In Part 2 nobody hands you anything, and finding a question worth asking is the work. Real analysis swings between those two modes constantly, so you should practise both.
Both parts use Pandas and Matplotlib. There is no starter notebook for either one. Build each notebook yourself.
Part 1 — Marriott Category Changes
The Case
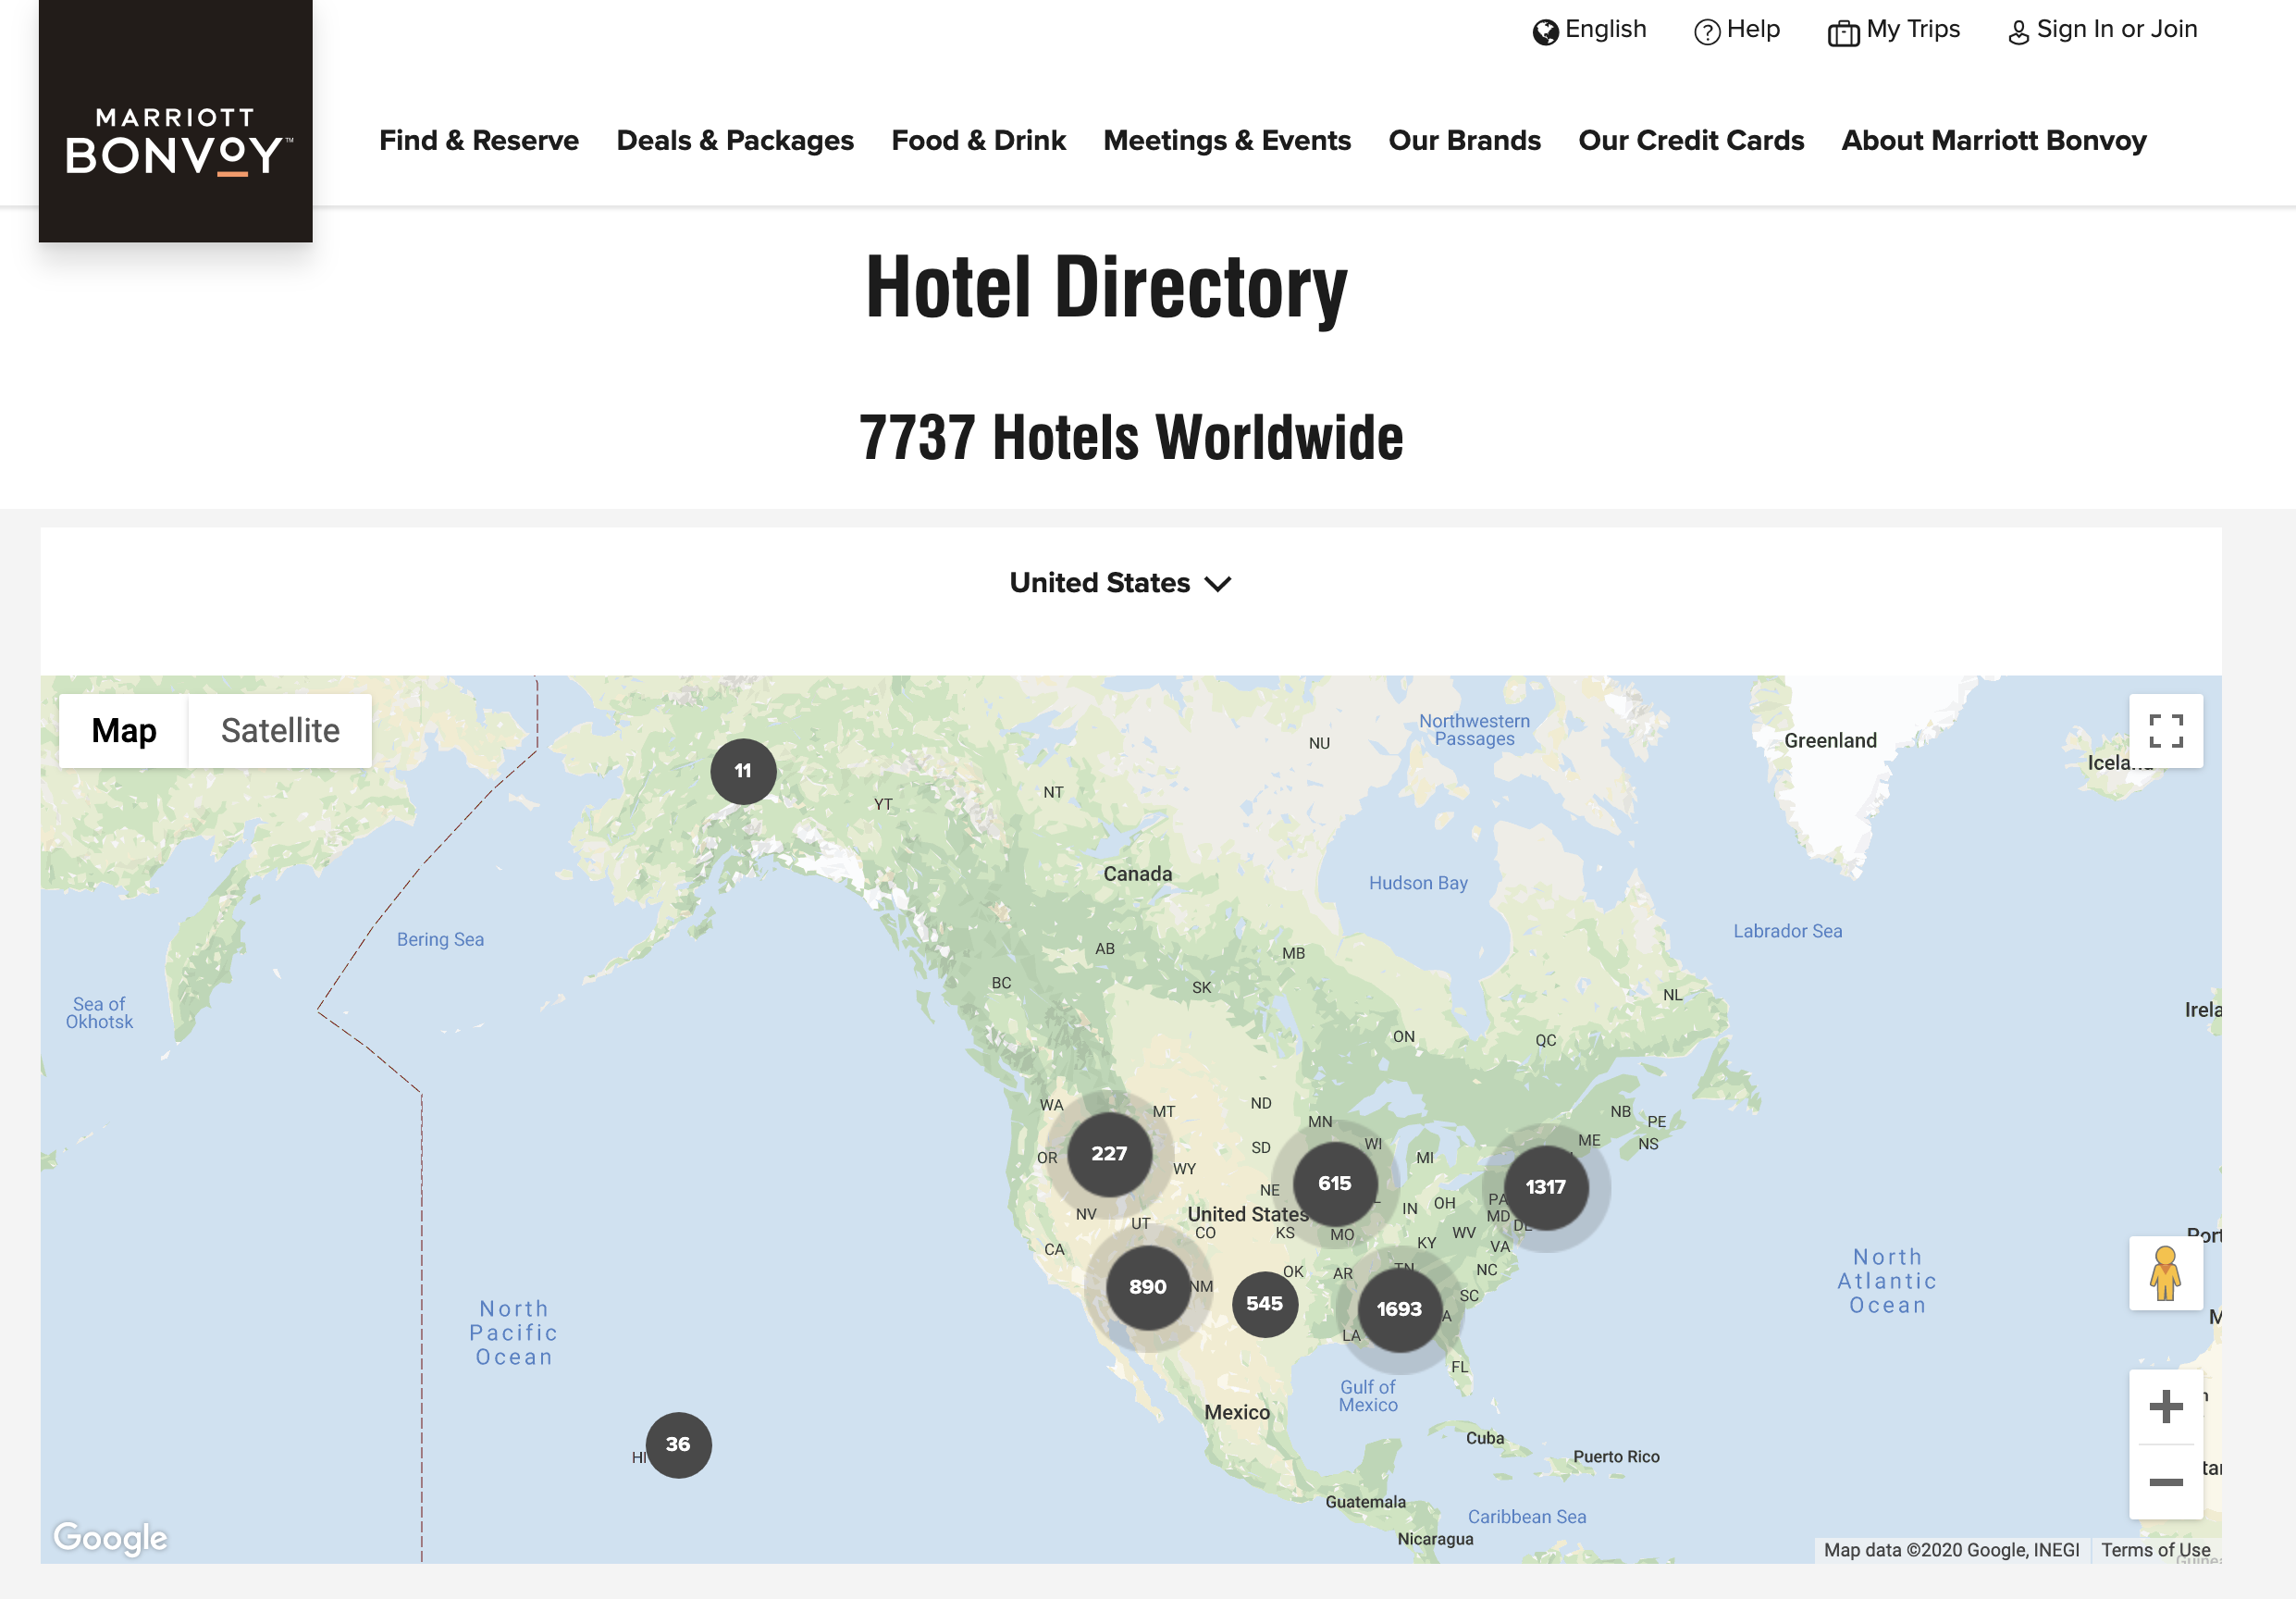
As of 17 February 2020, Marriott had 7,737 hotels worldwide.
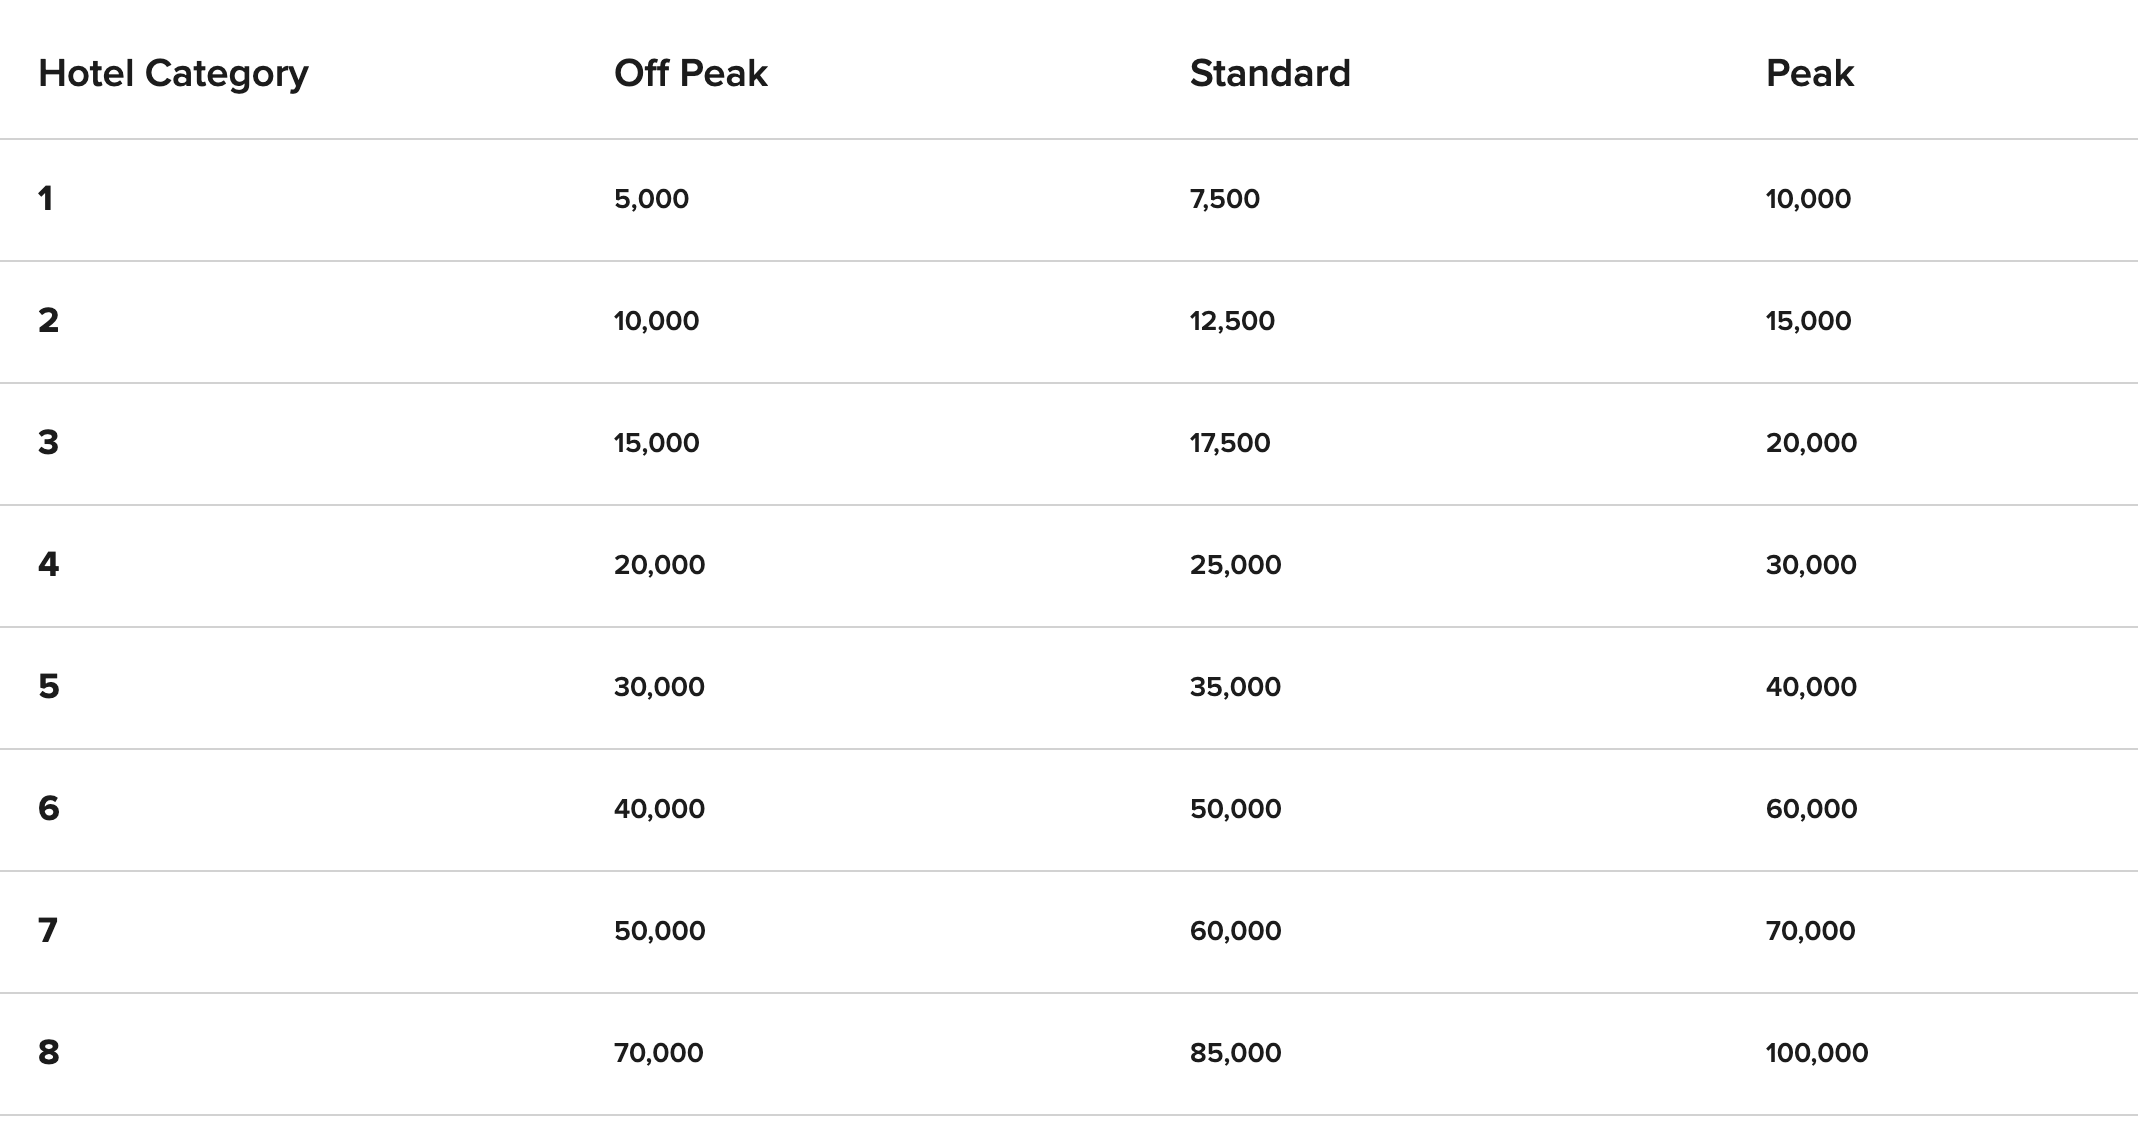
Marriott hotels are sorted into 8 categories, and the category sets how many loyalty points a free night costs. Marriott has since moved to dynamic pricing and retired this chart, so what follows is the scheme as it stood in 2020.
Every year Marriott re-rates hotels to reflect market conditions: room rates, occupancy, renovations. A hotel moving up a category costs its guests more points for the same night. A hotel moving down costs fewer.
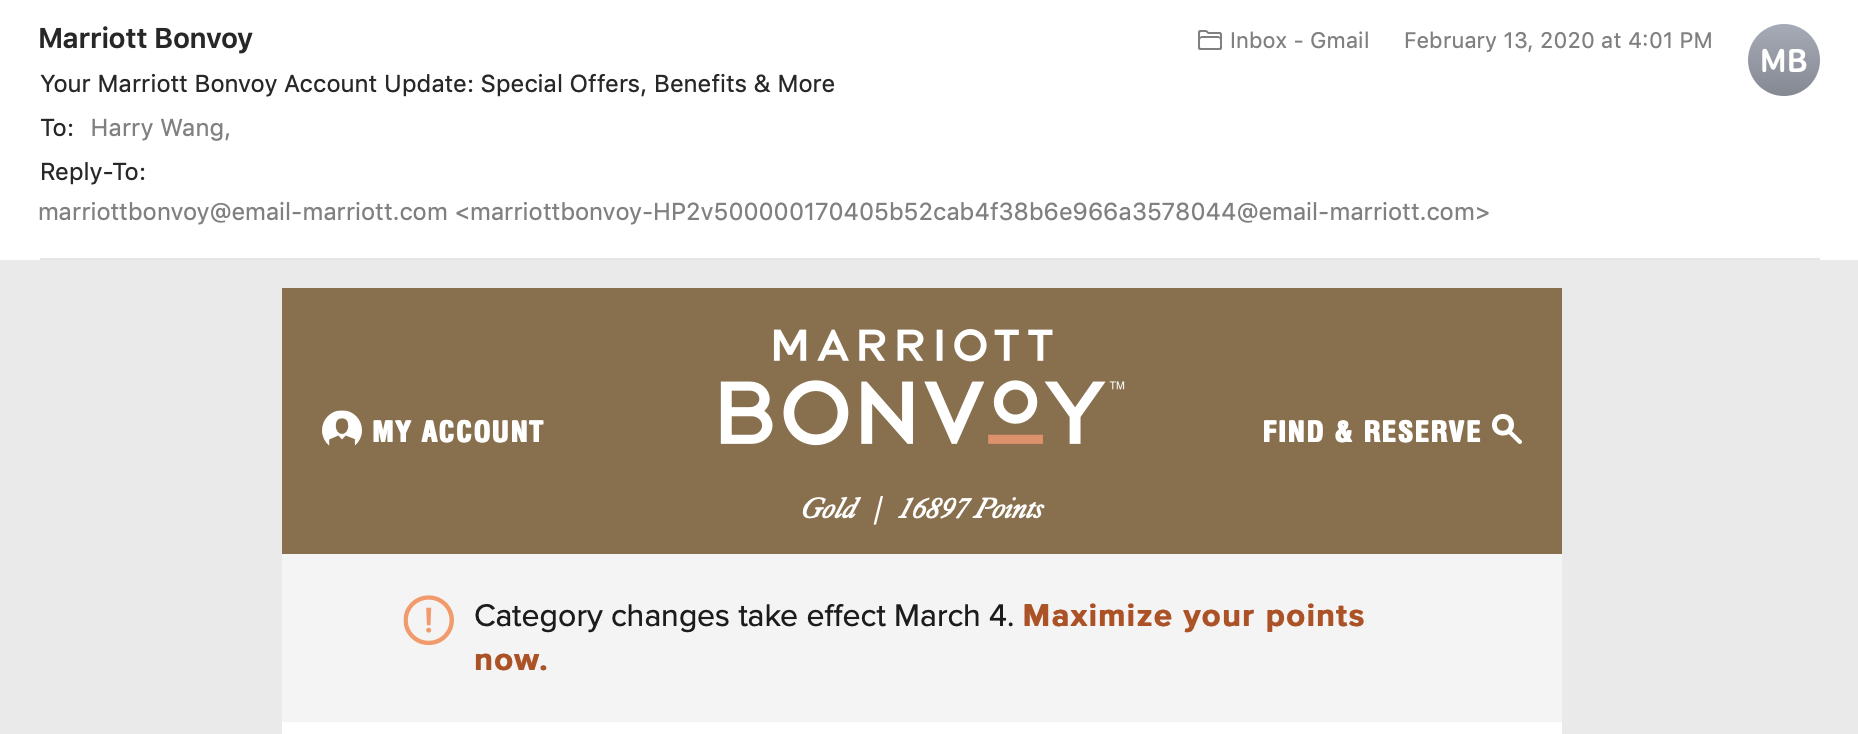
The 2020 changes took effect on 4 March 2020.
The dataset is every hotel whose category changed that year:
marriott-category-changes-2020.csv.zip
Create marriott-analysis.ipynb and answer all seven questions below. For each one, show the code, show the result, and write the answer in a markdown cell. Code and output alone are not an answer.
The Questions
1. Show the structure of the dataset. For every column, say what it holds and what its data type is, in the form "brand is a categorical feature stored as object/string".
2. Answer all four:
- How many hotels are in this dataset?
- How many distinct brands do they belong to?
- Which destination has the most hotels here, and how many?
- How many brands in China have category changes?
3. What is the average new price for each brand, and which three brands are the most expensive? Draw a bar chart of the result with a figure size of (15, 5), a title, and both axis labels.
4. Draw a bar chart of the number of affected hotels per brand in the USA. Figure size (20, 5), with a title and both axis labels.
5. What percentage of Marriott's worldwide hotels were upgraded in 2020? The worldwide total is in the case description above, not in the dataset. Say why that distinction matters.
6. Answer both:
- List any hotels that moved by more than one category, such as 3 to 5, or 7 to 4.
- List every JW Marriott hotel in China that was upgraded.
7. It is February 2020 and the changes take effect on 4 March. You are planning April travel to Florence, Italy and to Hong Kong, China. You only stay in category 8 hotels, or in a category 7 hotel that was downgraded from 8. You want the most night for your points. Which hotels should you book, and should you book each one before or after 4 March? Explain the reasoning behind each choice.
Part 2 — Find Your Own Questions
This part is open-ended. Nobody tells you what to compute. The question has to be a business question, and the answer has to come out of the data.
Find at least two business questions worth answering, answer them with Pandas, and report what you found. Anyone can produce a chart. What is being graded is whether you picked a question a business would pay to have answered, and whether you know when a picture beats a table.
The Data
Download supermarket_sales.csv from Sales of a Supermarket on Kaggle and put it next to a new notebook called supermarket-analysis.ipynb. The file is 131 kB and you need a Kaggle account to download it.
Three months of transactions, January to March 2019, from a supermarket chain with three branches in three cities in Myanmar. One row per invoice.
Nothing else is described for you on purpose. Go and look.
What to Hand In
For each of your questions:
- The question, in one sentence, phrased so a number can answer it. "How do sales vary?" is not a question. "Which branch is weakest in which product category?" is.
- Why you asked it, and who at the company would act on the answer. Name the role, and say what decision changes depending on what you find.
- What you found. Give the size of the difference as a ratio or a percentage, not two raw numbers. The same 4,000 dollar gap means nothing between two branches that each turn over 106,000, and means roughly a quarter of the business when it falls between two product lines inside one branch. A raw number cannot tell your reader which of those they are looking at.
- Charts, only where they earn their place. A question might need none, one, or several. For every chart you make, say what it shows that the numbers alone do not. Where you decided a table was enough, say so and why. Choosing not to chart is a real answer and is graded the same as a good chart.
Then close with one short paragraph: of your findings, which is most worth the company's time, and why that one?
The Few Rules
- No
forloops over rows. Masking,groupby()andpivot_table()do the work. - At least one chart somewhere in Part 2. Any single question may not need one, but you cannot hand in a report with no chart in it at all.
- Any chart you make needs axis labels and a title that states the finding, not the variable. "Branch B under-sells food and beverages by 36%" beats "Sales by Branch and Product Line".
Submission
Upload both notebooks to Canvas, marriott-analysis.ipynb and supermarket-analysis.ipynb.